Saturday, October 25, 2008

WEEKLY SECTOR WRAP-UP (Oct 20-24)


Don't forget to try the Free Trend Analysis. It's FREE, so give it a shot!

SINFEST HAS IT RIGHT ON


Don't forget to try the Free Trend Analysis. It's FREE, so give it a shot!

Friday, October 24, 2008

PETER'S MONEY MANAGEMENT ADVICE

Off to a party! I'll be back tomorrow and will post final details about the Premium Stock Pick newsletter and the Private One-on-One Coaching program.

Can Peter become a hedge fund manager?


TODAY'S ACTION

If you want to see a day where technical patterns repeatedly breakdown and fail, then today is your day. It's been a while since I've seen breakdowns bounce hard into their range right after the break, or the same with break outs. These are false breakouts and breakdowns and they snare even the most experienced technicians. The only way to protect yourself is to recognize that a pattern is failing and get out.

Around 11:20AM, we broke out but formed a slight head-and-shoulders and broke down at around 12:10PM, but rallied back up to break out from a small consolidation zone. Then, we failed to follow through and we broke down at around 1:40PM but found near-term secondary support at 860 and rallied back into consolidation to breakout one more time at around 2:10PM. We formed a flag which bounced off of initial support and broke out, turning parabolic intra-day...only to fail again and create the massive neutral trading range. In the last 10 minutes, we happened to slightly breakdown out of this range.

If you ask me, today was NOT a tradeable day. So many mental stops on trades in my day trading segment got hit that I now have a pulsing headache and am taking Acetaminophen. Where's the morphine when you need it?

What's interesting is that all of this (including the headache) fits into the Sentiment Cycle. We are in the stage of despair. While you're at it, you can also read my August 28 article on the Guide to Bear Markets.


S&P 500 (SPX) 1-day

S&P 500 (SPX) 10-Day

S&P 500 (SPX) 3-Day

The Bigger Picture:
Don't forget to try the Free Trend Analysis. It's FREE, so give it a shot!

MARKET CARPET & BREADTH

Back in the bloody red...

Don't forget to try the Free Trend Analysis. It's FREE, so give it a shot!

SHOULD BE AT CONGRESSIONAL HEARINGS

27 STATES IN RECESSION, 14 MORE "AT RISK"

In March 2008, only 5 states were in recession (Arizona, California, Florida, Michigan, Nevada). Now, 27 states are in recession and 14 more are at threatened levels. So, despite what the textbook definition of a recession is, the map just answered the "Are We in a Recession?" question for you. On a technical level if I could, I would short the s* out of this map. The question is, how long will it take for the "at risk" states to sink into a full-blown recession?

Don't forget to try the Free Trend Analysis. It's FREE, so give it a shot!

Thursday, October 23, 2008

TODAY'S ACTION

We had lot of intra-day patterns formed today including, an ascending triangle, a descending triangle, a wedge, a double bottom, and flags. Each pattern led to another which is the reason why pattern recognition is so important. If you didn't know what the chances of a breakout of breakdown was for each pattern, then you'd be SOL and would be trading at the mercy of the market. Patterns foreshadow what is to NOT to come, but what is MOST LIKELY to come. Today was a clear cut day where each pattern did what they were MOST LIKELY to do. After 10 days, we are still in a triangle, but it is a descending one. The support we do have is a major one. Also note that volume is picking up, higher than the last 3-4 days. Make note of support and resistance in the 3-day chart for tomorrow's trading.

S&P 500 1-day

S&P 500 3-day

S&P 500 10-day

Don't forget to try the Free Trend Analysis. It's FREE, so give it a shot!

TODAY'S BREAKOUTS & BREAKDOWNS

We did well today from 3:00PM onward. I saw a double bottom forming when the right low became apparent that it wouldn’t cut through the left low and therefore went long. Going long might last until tomorrow’s open or tomorrow’s close depending on the momentum that is sustained (or is non-existent) throughout the day. The rally was encouraging as it actually made it higher without breaking down at 3:30PM. There might be more UFO sightings than stock rallies finishing strong into the close, who knows?

We made 9 new highs and 1,382 new lows today, not anything to celebrate over, but most of those stocks closed higher than the low they made. Given the large breadth imbalance, it’s surprising that we even closed positive (S&P 500, DJIA). Today, I found 6 solid breakouts (the highest count in weeks) and of course, I had to limit the number of breakdowns I would include today. They are all below with my comments.


Don't forget to try the Free Trend Analysis. It's FREE, so give it a shot!

MARKET CARPET & INDUSTRY ANALYSIS

Healthier than yesterday's Ebola attack


Don't forget to try the Free Trend Analysis. It's FREE, so give it a shot!

THE FINANCIAL CRISIS AND THE ROLE OF FEDERAL REGULATORS

DOUBLE-BOTTOM! WHO'S LONG WITH ME?

Don't forget to try the Free Trend Analysis. It's FREE, so give it a shot!

TODAY'S UPGRADES & DOWNGRADES

Don't forget to try the Free Trend Analysis. It's FREE, so give it a shot!

HOW GOOD ARE YOU AT TECHNICALS?

WARNING: Highly Addictive

Chart Game

Wednesday, October 22, 2008

MY WATCH LIST UPDATE

I wrote a post yesterday on stocks that I was going to trade for 1-3 day holds. Here's the link: http://weeklyta.blogspot.com/2008/10/my-watch-list.html#links

Out of the 11 picks, you would have profited off of 10 of them today, the next day. The only "loser" was RJET (for a long) and it's only down -2.5% but is still consolidating normally and it's still a hold for a breakout play. Reader's would have made between 7-10% in their portfolio today alone depending on where they entered.

Executed Short:

TSFG +10.36%

MXIM +6.48%
RDN +10.99%
SBLK +6.74%
SRZ +4.00%
CIT +15.14%
ERIC +7.25%
FTBK +12.16%
MBI +16.50%
MGM +13.67%

*Results may vary, but you would have still made a killing with me, instead of losing $X today.

I will no longer publish my watch lists because this was sort of a "sample" of what prospective members will get in their premium newsletter which I will be launching in November. So far, there is tremendous interest in the newsletter which makes it actually worth my time. My goal is to make you money, immediately. Not a week later, not a month later. Immediately.

A post with more details on the premium newsletter and the private coaching program are at the bottom of the page. Or you can just visit the post link here: http://weeklyta.blogspot.com/2008/10/new-things-needing-your-opinions.html#links

TODAY'S ACTION

During pre-market, you just have a feeling that there will be a forceful gap that will break through everything. Or, if you don't that gut feeling, you can simply look at a 3 or 5-day chart and look at how the open cut through several support levels. Combine that with the fact that the market didn't even attempt to fill the gap, nor did it have any energy to do so within the first 30-mins. The day slowly drifted down until it quickly hit the abyss at around 3:30PM. The short signal came the moment the gap was forceful enough to not be able to fill at all. A secondary signal came at the first breakdown of the pennant. A third signal came at the breakdown of the flag. The market does give second chances if you miss the first, so pay attention.

S&P 500 1-day

S&P 500 3-day

S&P 500 10-day

VIX 1-day

Don't forget to try the Free Trend Analysis. It's FREE, so give it a shot!

THE MARKET TODAY WAS WHAT??? OVER!!!

MARKET CARPET & INDUSTRY ANALYSIS

Don't forget to try the Free Trend Analysis. It's FREE, so give it a shot!

TODAY'S BREAKOUTS & BREAKDOWNS

We’re broken “the triangle”, that dreaded zigzagging consolidation zone where most stocks made zero progress for the past 10 days. Today’s gap triggered it all by breaking through two short-term resistance areas and being unable to fill the gap, had no other choice but to “flag and fail”. We also hit a short-term intra-day selling climax which was very visible from 3:00-3:30PM. Is it the bottom? I don’t think so. We have a much greater chance of testing 1) October 16th’s low and finally 2) October 10th’s low.

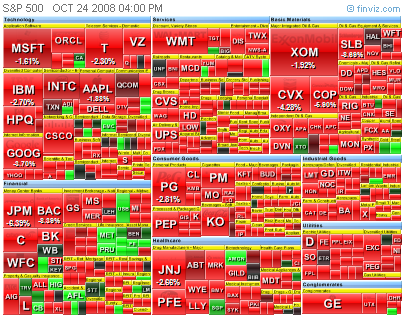
As for breadth, we did pretty good considering the massive drop we had today, but we’re still in the area of having new highs in the single-digits and new low in the multi-hundreds. I kept saying that a rally cannot take place with these numbers being hit. This trend has been going on for weeks now and as long as we’re in neutral/negative territory, the market’s breadth will only get worse. We had slightly increasing volume today compared to yesterday and Monday, but it was all mostly selling volume and not true buying volume. The market will break consolidation to the downside in full force if this is not taken care of quickly.

As for breakouts and breakdowns, I found two clean breakouts and numerous breakdowns. The first two charts are breakouts and the rest just sort of died today. They all have my comments on them.


Don't forget to try out the Free Trend Analysis. It's FREE, so give it a shot!