I am getting bounce backs because some of your e-mail accounts are over quota. Try to make some room in the e-mail account or even create a new temporary e-mail address. I have another 100MB+ worth of additional files that I will send, but I can't do that if I'm getting the 'over-the-limit' errors. These are your Christmas presents.
I have sent 21 batches so far. I'll continue on Sunday. If you created a new e-mail account just to collect the files, let me know by then. If I get an error from someone, I'll have to stop sending them again. If you don't want thousands of dollars worth of stuff for free, then something is seriously wrong with you. Let me know and I'll remove you from my "nice" list and put you on the "naughty" one.
Saturday, December 27, 2008
Friday, December 26, 2008
TODAY'S ACTION
Another boring day with nothing particularly interesting to note.
SPX Charts by time frame:
1-day: depicts a rounded cup pattern.
3-day: possible ascending triangle.
5-day: a pennant.
10-day & 35-day: locked within a neutral range.
3-month: All of the above, but the market is also bound by the 20-day and 30-day MA. The entire day was within that range and formed a "spinning top", an irrelevant candle in most cases. Note: very low holiday volume.
 SPX 1-day
 SPX 3-day
 SPX 5-day
 SPX 10-day
 SPX 35-day
 SPX 6-month
I've also added several stocks on my watch list for potential breakouts.
SPX Charts by time frame:
1-day: depicts a rounded cup pattern.
3-day: possible ascending triangle.
5-day: a pennant.
10-day & 35-day: locked within a neutral range.
3-month: All of the above, but the market is also bound by the 20-day and 30-day MA. The entire day was within that range and formed a "spinning top", an irrelevant candle in most cases. Note: very low holiday volume.
 SPX 1-day
 SPX 3-day
 SPX 5-day
 SPX 10-day
 SPX 35-day
 SPX 6-month


Wednesday, December 24, 2008
TODAY'S ACTION
Hey...Merry Christmas!!!
The market is always boring on Christmas Eve. You can tell if someone may be a trading junkie if they sat through today's entire 9:30AM-1:00PM session, despite me telling them to occupy their time with important life stuff, such as bartering with desperate retailers. Sometimes, alleged junkies will get hostile towards you if you ever try to stop them in their quest to make a few bucks on one of the lowest volume days of the entire year. I did say 'go shopping', didn't I?
The market struggled as we traded in an upward channel today. It's nothing special since we're still in the neutral range that's bound by 855-880 on the SPX. The wedge is clearly broken, but that doesn't mean the market cannot trade sideways for some time. We have to wait for confirmation. What's interesting is that the VIX is forming a flag (so far). This too needs some type of directional confirmation before I get serious.
I think it's official: retailers are screwed. They usually get 15% of their sales in the 2 weeks after Christmas, with December (plus Black Friday week) usually making up 40% of annual sales for many retailers. I don't think they're going to see that 15% and they're definitely not going to see 40% for December. They'll be lucky to have 40% sales for the entire calendar year.
Of course, retailers are giving stuff away at huge discounts, but they're not getting as much traffic as they should be getting. People are actually negotiating at the stores and I hear that deals are being made regardless of stick prices. The worst environment for retail, perhaps since the Great Depression, will mean only one thing: massive closures, liquidations, chapter 11's, and whatever else you want to call it.
This will weight heavily on commercial real estate. I've been a commercial real estate investor for 4 years, so I've never actually experienced a downturn, but I can tell you what will happen. Here's a short lesson on what will happen shortly:

Cap rates and cash-on-cash returns will be horrendous. I think that cap rates will be sub 4-5% for Class A's, 6-7% for B's, 8-9% for C's, and 10% for the crappiest properties on Earth (D's). Property sub-classes are determined primarily by cap rate, net income, age of the property and location, among other factors.
There are 4 cycles in the real estate market. We are in the Buyer's Market Stage I, going onto Stage II. If you're buying stuff, I hope you're buying for cash flow, and not for capital appreciation. What's going to happen is that there will be a massive oversupply in commercial real estate fueled by a large % of vacancies. Many investors have millions of dollars in upcoming debt service obligations, but with the lack of available credit and cash flow (or just regular cold, hard cash), they will be forced to surrender their properties.
The value of commercial properties are determined in three different ways: 1) sales comparison approach, income approach, and replacement costs approach. Unfortunately, 2 out of 3 (sales & income) will work against investors. By the way, the cap rate is determined by dividing the net operating income (NOI) by the value (selling price). The cash-on-cash return (CCR) is the cash flow (NOI - debt service) divided by the acquisition costs (down payment + all cash needed for the deal).
The CCR basically tells you that for every $1 you spent, how much of that $1 you'll get back after the first year. Unfortunately, for those investors that bought all sorts of office space, strip malls, public storage, and other stuff in 2006, 2007, and 2008, their CCR will be terrible because the lack of cash flow will cut the CCR down to the single digits (I look for 15-20% in this stage of the market). After the first year, the return-on-investment (ROI) can be calculated. That is, the NOI - debt service + principal reduction divided by acquisition costs. Unfortunately, this number will be horrible as well because it's based on the NOI.
This process takes many, many, many months because the commercial real estate market is much slower than it's residential counterpart. Closed residential sales usually take 30-45 days (if you're lucky). From due diligence, site investigations, surveys, and everything else until actual closing, a single commercial deal takes between 2-5 months. You can be assured that this shoe will drop well into 2010 and the secondary effects will still be felt in 2011.
And you thought I was just some kinda chart junkie...
Anyway, I hope people didn't get too depressed by that. Indeed, that was the short version.
I wish everyone here a wonderful, safe, and fun-filled Merry Christmas! See you Friday!
 SPX 1-day
 SPX 3-day
 SPX 5-day
 SPX 10-day
 SPX 35-day
 SPX 3-month
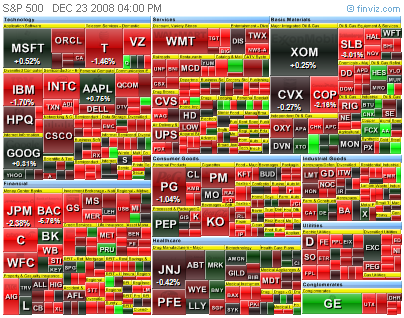
Tuesday, December 23, 2008
TODAY'S ACTION
It's going to be really quiet today. We have a half day today, which means that we close at 1:00PM. We have several economic reports coming out in the morning (not that they even matter these days): Durable Goods (8:30AM), Personal Income/Outlays (8:30AM), Jobless Claims (8:30AM), and don't forget that we have the EIA Petro report (10:35AM) and the EIA Nat Gas report (12:00PM) coming out on the same day. Could be volatile for you oil/gas folks.
The markets have been very quiet, just drifting down in an orderly fashion. We did break the November low trend line but before I go crazy on the short positions, I'll need comfort knowing that we're going to breakdown below 850 on the SPX (see SPX 35-day). We could be trading in a range, however a breakdown will kill the chance for neutral bound trading. This confirmation should come either today or Friday.
Glancing at individual sectors, I'd have to say that materials, industrials, financials, technology, and consumer discretionary look weak as hell. Utilities, energy, consumer staples appears to be neutral (going on to becoming weak). Healthcare is still doing the best (not breaking out or anything, but consolidating). In addition, sub sectors such as retailers and home builders look like they're about to fall off (ex. BZH, HOV, JNY & LIZ - already off).
Here's the problem with the rally: it's taking too long and the set up is breaking down. Obviously, the market is running out of steam and it doesn't matter if it's a holiday week. Many traders have withdrawn from the markets, including the big money, and there's simply a lack of interest in the market as evidenced by multi-week trading on lower and lower volume.
Likewise, the VIX reversed, even if it was 1%. Yesterday's action created a 4th tail and suggests more room to the upside if the VIX penetrates above the 100-day MA. Watch the VIX carefully, even though it's kinda busted. Watch the 45-46 level.
Let's see what happens. If I were you, I'd spend all of tomorrow going shopping for those 50-80% discounts. All-niters are not just for desperate students anymore. It's typically not worth trading on Christmas Eve.
 SPX 1-day
 SPX 3-day
 SPX 5-day
 SPX 10-day
 SPX 35-day
 SPX 5-month
 NASDAQ 5-month
 DJIA 5-month
 VIX 5-month
 Don't forget to try the Free Trend Analysis. It's FREE, so give it a shot!
The markets have been very quiet, just drifting down in an orderly fashion. We did break the November low trend line but before I go crazy on the short positions, I'll need comfort knowing that we're going to breakdown below 850 on the SPX (see SPX 35-day). We could be trading in a range, however a breakdown will kill the chance for neutral bound trading. This confirmation should come either today or Friday.
Glancing at individual sectors, I'd have to say that materials, industrials, financials, technology, and consumer discretionary look weak as hell. Utilities, energy, consumer staples appears to be neutral (going on to becoming weak). Healthcare is still doing the best (not breaking out or anything, but consolidating). In addition, sub sectors such as retailers and home builders look like they're about to fall off (ex. BZH, HOV, JNY & LIZ - already off).
Here's the problem with the rally: it's taking too long and the set up is breaking down. Obviously, the market is running out of steam and it doesn't matter if it's a holiday week. Many traders have withdrawn from the markets, including the big money, and there's simply a lack of interest in the market as evidenced by multi-week trading on lower and lower volume.
Likewise, the VIX reversed, even if it was 1%. Yesterday's action created a 4th tail and suggests more room to the upside if the VIX penetrates above the 100-day MA. Watch the VIX carefully, even though it's kinda busted. Watch the 45-46 level.
Let's see what happens. If I were you, I'd spend all of tomorrow going shopping for those 50-80% discounts. All-niters are not just for desperate students anymore. It's typically not worth trading on Christmas Eve.
 SPX 1-day
 SPX 3-day
 SPX 5-day
 SPX 10-day
 SPX 35-day
 SPX 5-month
 NASDAQ 5-month
 DJIA 5-month
 VIX 5-monthDon't forget to try the Free Trend Analysis. It's FREE, so give it a shot!
Monday, December 22, 2008
TODAY'S ACTION
I'm sick of these last half-hour shenanigans, but this time it was different. I actually expected this it, because the market was at it's lower range during 12/12 - 12/16 when the market formed a double bottom. This is an example of how charts can provide some value in anticipating pullbacks and throwbacks and possibly, the dreaded "WTF pattern".
WTF Pattern (noun): A technical pattern that usually occurs during the last hour or last half-hour or even the last 5-mins of any trading day. It doesn't care if you're a bull or bear. It is non-biased and only causes extreme agony and stress for the overnight holder. Toward the end of the day, traders sit at their trading desks bewildered and confused as to what just happened prior to the closing bell. This creates a nationally coordinated, highly audible response to the unusual action which begins with a "WTF!!!" and may continue with creative vulgarity to express uncontrollable anger and dismay (see SPX 1-day).
Besides the WTF pattern that occurred around 3:40PM today, we had a series of bear flags that actually did what they were supposed to do -- breakdown, making today a very easy day to trade. The 880 breakdown was a key shorting level because the market declined below the 12/18 V-bottom and 12/16's pre-Fed flag level. After that, the market didn't have much short-term support.
In addition, I stated that the VIX was forming tails at the 100-day MA and it may reverse. The VIX fell as low as 42.75, went positive to 46.69, but backed off in the last 20 minutes (WTF). This is the 3rd tail on the VIX.
Right now, it looks like we are closer to forming a bearish wedge than an ascending triangle. It appears that both sellers and buyers are exhausting themselves (notice extremely low volume today). Many sellers sold a while ago and buyers don't really have the buying power (they can't even buy Christmas presents), therefore, we're stuck in this slow and boring tape which I'm sure is driving some people mad. The market will stay rather quiet this entire week as more people look forward to their Christmas festivities rather than risk losing more money. For most people, they'll be glad that 2008 is finally OVER.
Look at 10-day & 45-day charts of the SPX for support/resistance levels and actually write them down. It's easy to forget about them while you're on the battlefield. Knowing these key levels helps prevent panic selling or impulse buying. You'll also be aware of why and where bounces occur so you're not caught off guard. This is true, unless you get hit by the WTF pattern in which case you'll only have seconds to react to the idiotic program trading and/or manipulation.
I just realized that the ProFunds Group, parent of ProShares, is only 19 blocks away from where I am. Many people seem to be dissatisfied with their 2x ETFs. After I sell my holdings, if you'd like me to drive by and throw Molotov cocktails at the building, let me know.
Anyway, we're at the 12/12 - 12/16 lower range, but we're also sitting on top of the 30-day MA. The market could continue this rally for a short period of time until it hits 875 (20-day MA), 880, and maybe even 890 (50-day MA). After a bounce, if the SPX drops below 860, we would have formed a lower high which will confirm a bearish wedge pattern. For the market to burst through 920, it will probably require a catalyst greater than the Fed's rate cut, or maybe Santa coming to town would just do. In any case, the market is running out of time and it will soon make a decision with or without you.
 SPX 1-day
 SPX 3-day
 SPX 5-day
 SPX 10-day
 SPX 45-day
 SPX 3-month
 DJIA 3-month
 NASDAQ 3-month
 Russell 2K 3-month
Subscribe to:
Posts (Atom)


