Today's pattern consisted of the smackdown from that 905 SPX resistance level (actually), but a final breakdown of the 885-890 SPX support level was unanticipated until it made it's way down there, obviously. Once the market got to the 885-890 SPX level, the probabilities changed immediately. The risk/reward profile shifted. The beauty of technical analysis is that the patterns evolve every second of the day and you can stack the odds in your favor as the picture slowly forms.
Believe it or not, we're still in the flag. A -195 point move on the Dow is nothing compared to some of the declines we get. If we break this channel, we're done. The flag would fail entirely.
Looking at the volume, it shows that we're still consolidating, so don't get too excited about anything. If it was a genuine breakdown, it would have been on high volume.
875 SPX is the immediate support level and the 20-day MA at 860 SPX provides secondary support. Immediate resistance is at 885 SPX and everything above that.
Due to the uncertainty and the desire to protect profits, I chose to remain hedged @ 40% long/60%. The only way I get heavy on one side is if a clear direction is achieved. Advice from my post yesterday: day trade, hedge (swing) or get into cash during consolidation.
UPDATE: Futures are down like mad. If this keeps up before the market opens, then we have "officially" broken, and a flurry of selling will ensue. I will look to short the hell out of this market at the most appropriate time.
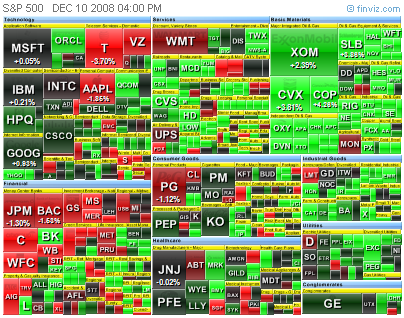
 SPX 1-day
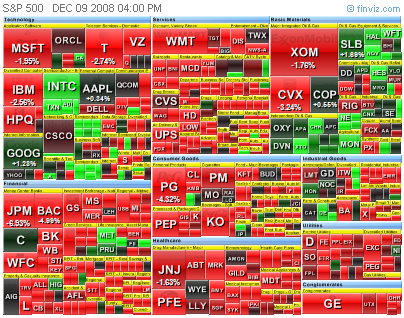
 SPX 3-day
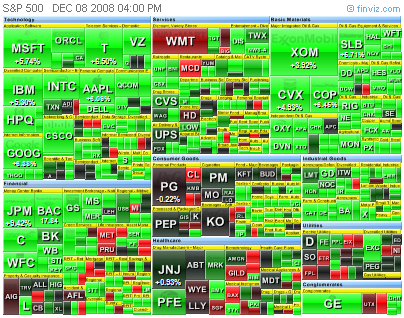
 SPX 5-day
 SPX 10-day