Wednesday, December 31, 2008

HAPPY NEW YEAR!!!

Happy New Year!

This year was the year that defined “smart money” and “dumb money”. There was very little “in between”. This year was also a year full of the unexpected. Complete shockers. Who would have known that all of this stuff would happen?

The only way to trade was to expect the worst…even when we didn’t know how bad it could get. I remember pulling all-niters on Sundays in October, just because I knew something would happen! I’m sure many others had sleepless nights.

I am also sure that many people who have their money managed by a mutual fund or a shitty hedge fund may want to re-think where they invest. The biggest investment should be in yourself through education. You are the master of your money. I met my target of reading over 100 books this year. I read 113. What’s your target for 2009?

The fact is, I turned 24 just last month and I made north of 265%, my best year ever. I made a killing in CWST to cap off the year (just ask my students). I have an I.Q. of about 120, so I’m not a genius, I am just an average person. In fact, I failed Calculus I the first time I took it. The point is, anyone with the right mindset can become a successful trader – yes, even in the worst crisis of our generation.

I am glad that I finally stepped up to the plate to create this blog for the many readers who did want to learn about technical analysis, chart reading, and short-term trading. Going into 2009, I will make my best effort in presenting the technical picture of the market on a daily basis. I take pleasure in doing what I do best.

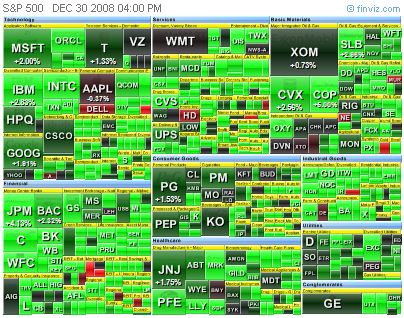
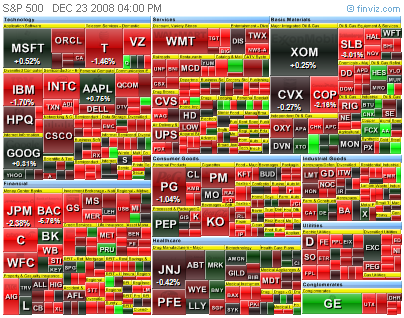
Below are the usual charts but also my predictions for 2009:


SPX 10-day

SPX 40-day

SPX 4-month

VIX 4-month
---------

The S&P 500 will re-test the 750 lows in the first half of 2009, and we will close below 700 by the end of 2009. This bear market will not end in 2009.

Crude oil will stay below $75/barrel for all of 2009.

Gold will break out above $1100/oz.

The VIX will hit 100 for the first time ever.

Posted unemployment will hit 10.5%. Total Unemployment (U-6) will hit 20%. The Employment Diffusion Index will hit the teens.

Commercial real estate values will drop 30-40%. Land development, office space, warehouses, shopping malls, hotels, and resorts will do the worst. Large multi-family properties will do the “best” because they will house all the folks who will lose their homes.

20% of retailers will file for Chapter 11 bankruptcy.

The bailout money will run out and the Fed/Treasury will request an additional package…and be denied. This debate will drag on for weeks and weeks.

Numerous local municipalities and/or states will go bankrupt. Many states will be unable to pay out full unemployment benefits.

The U.S. will be involved in another war.

A major terrorist attack, economic/financial, and/or political crisis will hit the U.S.

Martial law will be declared and FEMA’s Executive Orders 10990-11921 will be activated by the President. Military units will be deployed on the streets of America. The UN will continue to ship large numbers of military vehicles to the US mostly via Port of Beaumont, TX. There will be a massive build up of military equipment.

----------

Ok, maybe not the last one, but you get the idea. I don’t see how our bear market (in the worst crisis since the Great Depression) can last for only 2 years. The tech bear lasted for more than 2 years and that didn’t even involve a global credit crisis! Bulls should not get too comfortable in 2009. There will be disappointments.

I think this will once again be a trader’s market, rewarding those that are nimble. Join me in battle next year and let’s slay this motherfuckin’ dragon and make some serious money!

P.S. Have fun tonight and tomorrow and try not to get into a situation where YOU’LL need a bailout!

STILL GETTING BOUNCEBACKS VIA FEELER

Make a lot of room please (at least 150MB+), so I don't have to re-send stuff to individual people. Attachments from e-mails that have already been sent can be saved on your computer and the e-mail can be deleted, thus freeing up space. I'll give the group one more day. The files will be sent over the span of several days/weeks. Thanks!

Tuesday, December 30, 2008

TODAY'S ACTION

Another last-hour WTF moment…great. Just when you’re about to wrap things up, a power rally shows up busting through the door at the end of the day. I’ve been in cash the whole day (still am), so it didn’t make any difference to me. The action at the end of the day brings the SPX close to the 50% retracement level, or the halfway point between range support and range resistance located between 855 and 920.

The SPX also closed above the 50-day MA, but it must maintain itself above the 50-day by not breaking down during a consolidation period like it did mid-December. At this point, we need to see a solid breakout above 920 SPX. Keep in mind that we do have major overhead resistance.

I stepped back and looked at the 4-month chart for a while and noticed that we formed a “Pipe Bottom”. These formations don’t occur as frequently as flags or wedges, but they are highly reliable. A pipe bottom is formed when there are two large spikes right next to each other after an extended decline. In addition, the volume must be high on either one or both of the pipes.

Statistics show that bear market pipe bottoms have a 4% failure rate and an average gain (rally) of +32% which makes this a highly-reliable pattern (as we can already see). 23% of these formations have gained in excess of 50%. This is one of the few patterns that are confirmed “after the fact”, however, the point is not to say “duh”, but to get some sort of price target.

What’s interesting is that we also formed a seagull pattern. This pipe smoking seagull is about to get HIGH. Keep in mind that this is a “short-term” bullish reversal, which means that it will most likely be a temporary fix and we will test the 750 lows. It is unlikely that this is the THE bottom like many have been calling recently. However, it doesn’t hurt to partake in the rally until a good shorting opportunity presents itself.

We still need some confirmation because the holiday volume just doesn’t confirm any type of price action when more than half the players aren’t even participating.

Here are the details:


SPX 10-day

SPX 40-day

SPX 4-month

For more on the Pipe Bottom, read Bulkowski's 964-page Encyclopedia of Chart Patterns.

Don't forget to try the Free Trend Analysis. It's FREE, so give it a shot!

Monday, December 29, 2008

TODAY'S ACTION

We are still in the range that is bound by 1) the 20-day MA @877, 2) the 30-day MA @863, 3) 855 support which doesn't seem to be cracking, and 4) the LH trend line ending at 870 (sky blue 35-day chart). All of these areas are boxing in the market within a tight and narrow range, a 'pattern' that hasn't been seen in months. However, this doesn't mean that there won't be any more volatility.

Today's action showed the strength of the 855 support level. At this point, the 50-day MA is now at the half-way point between 855 and 920. We'll have to break out of #1, #2, and #4 (above). Can any of this action be trusted? No. The holiday volume is so light that anyone with big money can actually bully around stocks all day long. We will get full participation only after New Year's.

It seems like only safe way to determine a breakout or breakdown is to wait until 3:57PM when you know for a fact that the market will close up or down +/- X, and then place your orders. What happened in the last few minutes yesterday showed that the "WTF" still lives and isn't going anywhere anytime soon. I am personally betting more toward the short side as of today).

Looking at the long-term, we could be in the eye of a Category 5 hurricane. The light winds and clear skies don't seem to bother people much because most people got the shit kicked out of them when the hurricane approached early this year. Looking at the previous reference point of the 2001-2002 crash, we may be in the eye for several months a.k.a. "dead money" for long-term investors. What will be true is that 2009 will once again be a year full of trading, instead of buying and holding. All we can do is make assumptions based on the past, unless you have a time machine.

For now, we just have to get out of this range. I wonder what the catalyst will be...


SPX 1-day

SPX 3-day

SPX 5-day

SPX 10-day

SPX 35-day

SPX 4-month

OK, first, let me sat that the market may NOT match 2002's bottoming process. Who knows what will happen. Just use this as a reference, not some kind of "sure thing".


2002-2003

2008

Don't forget to try the Free Trend Analysis. It's FREE, so give it a shot!

Saturday, December 27, 2008

SUBSCRIBERS & STUDENTS

I am getting bounce backs because some of your e-mail accounts are over quota. Try to make some room in the e-mail account or even create a new temporary e-mail address. I have another 100MB+ worth of additional files that I will send, but I can't do that if I'm getting the 'over-the-limit' errors. These are your Christmas presents.

I have sent 21 batches so far. I'll continue on Sunday. If you created a new e-mail account just to collect the files, let me know by then. If I get an error from someone, I'll have to stop sending them again. If you don't want thousands of dollars worth of stuff for free, then something is seriously wrong with you. Let me know and I'll remove you from my "nice" list and put you on the "naughty" one.

Friday, December 26, 2008

TODAY'S ACTION

Another boring day with nothing particularly interesting to note.

SPX Charts by time frame:


1-day: depicts a rounded cup pattern.

3-day: possible ascending triangle.
5-day: a pennant.

10-day & 35-day: locked within a neutral range.

3-month: All of the above, but the market is also bound by the 20-day and 30-day MA. The entire day was within that range and formed a "spinning top", an irrelevant candle in most cases. Note: very low holiday volume.


SPX 1-day

SPX 3-day

SPX 5-day

SPX 10-day

SPX 35-day

SPX 6-month

I've also added several stocks on my watch list for potential breakouts.

Don't forget to try the Free Trend Analysis. It's FREE, so give it a shot!

Wednesday, December 24, 2008

TODAY'S ACTION

Hey...Merry Christmas!!!

The market is always boring on Christmas Eve. You can tell if someone may be a trading junkie if they sat through today's entire 9:30AM-1:00PM session, despite me telling them to occupy their time with important life stuff, such as bartering with desperate retailers. Sometimes, alleged junkies will get hostile towards you if you ever try to stop them in their quest to make a few bucks on one of the lowest volume days of the entire year. I did say 'go shopping', didn't I?

The market struggled as we traded in an upward channel today. It's nothing special since we're still in the neutral range that's bound by 855-880 on the SPX. The wedge is clearly broken, but that doesn't mean the market cannot trade sideways for some time. We have to wait for confirmation. What's interesting is that the VIX is forming a flag (so far). This too needs some type of directional confirmation before I get serious.

I think it's official: retailers are screwed. They usually get 15% of their sales in the 2 weeks after Christmas, with December (plus Black Friday week) usually making up 40% of annual sales for many retailers. I don't think they're going to see that 15% and they're definitely not going to see 40% for December. They'll be lucky to have 40% sales for the entire calendar year.

Of course, retailers are giving stuff away at huge discounts, but they're not getting as much traffic as they should be getting. People are actually negotiating at the stores and I hear that deals are being made regardless of stick prices. The worst environment for retail, perhaps since the Great Depression, will mean only one thing: massive closures, liquidations, chapter 11's, and whatever else you want to call it.

This will weight heavily on commercial real estate. I've been a commercial real estate investor for 4 years, so I've never actually experienced a downturn, but I can tell you what will happen. Here's a short lesson on what will happen shortly:


Cap rates and cash-on-cash returns will be horrendous. I think that cap rates will be sub 4-5% for Class A's, 6-7% for B's, 8-9% for C's, and 10% for the crappiest properties on Earth (D's). Property sub-classes are determined primarily by cap rate, net income, age of the property and location, among other factors.

There are 4 cycles in the real estate market. We are in the Buyer's Market Stage I, going onto Stage II. If you're buying stuff, I hope you're buying for cash flow, and not for capital appreciation. What's going to happen is that there will be a massive oversupply in commercial real estate fueled by a large % of vacancies. Many investors have millions of dollars in upcoming debt service obligations, but with the lack of available credit and cash flow (or just regular cold, hard cash), they will be forced to surrender their properties.

The value of commercial properties are determined in three different ways: 1) sales comparison approach, income approach, and replacement costs approach. Unfortunately, 2 out of 3 (sales & income) will work against investors. By the way, the cap rate is determined by dividing the net operating income (NOI) by the value (selling price). The cash-on-cash return (CCR) is the cash flow (NOI - debt service) divided by the acquisition costs (down payment + all cash needed for the deal).

The CCR basically tells you that for every $1 you spent, how much of that $1 you'll get back after the first year. Unfortunately, for those investors that bought all sorts of office space, strip malls, public storage, and other stuff in 2006, 2007, and 2008, their CCR will be terrible because the lack of cash flow will cut the CCR down to the single digits (I look for 15-20% in this stage of the market). After the first year, the return-on-investment (ROI) can be calculated. That is, the NOI - debt service + principal reduction divided by acquisition costs. Unfortunately, this number will be horrible as well because it's based on the NOI.

This process takes many, many, many months because the commercial real estate market is much slower than it's residential counterpart. Closed residential sales usually take 30-45 days (if you're lucky). From due diligence, site investigations, surveys, and everything else until actual closing, a single commercial deal takes between 2-5 months. You can be assured that this shoe will drop well into 2010 and the secondary effects will still be felt in 2011.

And you thought I was just some kinda chart junkie...

Anyway, I hope people didn't get too depressed by that. Indeed, that was the short version.

I wish everyone here a wonderful, safe, and fun-filled Merry Christmas! See you Friday!


SPX 1-day

SPX 3-day

SPX 5-day

SPX 10-day

SPX 35-day

SPX 3-month

VIX 3-month

Don't forget to try the Free Trend Analysis. It's FREE, so give it a shot!

Tuesday, December 23, 2008

TODAY'S ACTION

It's going to be really quiet today. We have a half day today, which means that we close at 1:00PM. We have several economic reports coming out in the morning (not that they even matter these days): Durable Goods (8:30AM), Personal Income/Outlays (8:30AM), Jobless Claims (8:30AM), and don't forget that we have the EIA Petro report (10:35AM) and the EIA Nat Gas report (12:00PM) coming out on the same day. Could be volatile for you oil/gas folks.

The markets have been very quiet, just drifting down in an orderly fashion. We did break the November low trend line but before I go crazy on the short positions, I'll need comfort knowing that we're going to breakdown below 850 on the SPX (see SPX 35-day). We could be trading in a range, however a breakdown will kill the chance for neutral bound trading. This confirmation should come either today or Friday.

Glancing at individual sectors, I'd have to say that materials, industrials, financials, technology, and consumer discretionary look weak as hell. Utilities, energy, consumer staples appears to be neutral (going on to becoming weak). Healthcare is still doing the best (not breaking out or anything, but consolidating). In addition, sub sectors such as retailers and home builders look like they're about to fall off (ex. BZH, HOV, JNY & LIZ - already off).

Here's the problem with the rally: it's taking too long and the set up is breaking down. Obviously, the market is running out of steam and it doesn't matter if it's a holiday week. Many traders have withdrawn from the markets, including the big money, and there's simply a lack of interest in the market as evidenced by multi-week trading on lower and lower volume.

Likewise, the VIX reversed, even if it was 1%. Yesterday's action created a 4th tail and suggests more room to the upside if the VIX penetrates above the 100-day MA. Watch the VIX carefully, even though it's kinda busted. Watch the 45-46 level.

Let's see what happens. If I were you, I'd spend all of tomorrow going shopping for those 50-80% discounts. All-niters are not just for desperate students anymore. It's typically not worth trading on Christmas Eve.


SPX 1-day

SPX 3-day

SPX 5-day

SPX 10-day

SPX 35-day

SPX 5-month

NASDAQ 5-month

DJIA 5-month

VIX 5-month

Don't forget to try the Free Trend Analysis. It's FREE, so give it a shot!