Showing posts with label VIX. Show all posts

Wednesday, July 1, 2009

MARKET COMMENTARY (7-01-09)


Imperial Bolter - Astartes MK Vb Godwyn Pattern

---

We just started a new month, a new beginning. Hardly new, the market is still trading in a neutral range. The possibility of an H&S is still present, though this pattern takes months to form. For those that believe the H&S pattern is hocus pocus, let me remind you that the pattern marked the top in 2007 with a neckline break on the 1st week of January 2008. As a short-term trader, I have to take advantage of intra-day and multi-day swings, prior to any breakdown (or a rare failed pattern breakout).


Besides the magical lines on the charts, keep an eye on the 20- and 30-day MAs. We've been trading in this narrow range for the past 3 days. The 20 is located at 924 and the 30 is at 919. For the day, I will focus on the 905-928 range. For the intermediate, I would focus on 895-930.

I took a look at the breadth charts, mainly the NYSE NH-NL's ($NYHL), NASDAQ NH-NL's $NAHL, VIX, NYSE A-D line ($NYAD) and the NASDAQ A-D line ($NAAD). The New Highs-New Lows Index is on it's largest cumulative positive strech since the bear market started. The VIX is back to pre-Crash levels.


The most interesting thing that I found was when I compared the NYSE and NASDAQ (COMP) indices with their respective Advance-Decline (A-D) lines. The COMP is outperforming the NYSE, however, if you look at the A-D lines, the NYSE internals have fared much better.


Finally, on the bearish side, the European indices ($DAX, $CAC, $FTSE) are all forming bear flags. The 20-day MA served as the principal support level for all three, but they have now turned into resistance.The Asian markets are still level.


Saturday, May 16, 2009

WEEKEND OBSERVATIONS


First, I am 25% short (QID, TZA, FAZ, SRS) and 8% long (MRGE). I am net short with a neutral-bearish bias. Once/If I get to the 50% short level, then I am "committed" to the dark short side.


I would like to note the New Highs-New Lows Index and the VIX. The ones below are for the NYSE and the NASDAQ. Do you see a problem on the chart? I do. We had the biggest rally (+30.5% so far) since the bear market started yet we can't get a noticeable uptick in new highs. This, among other things, tells me that the bear market is not over yet. There is no improvement here if we look at the 2-year picture.


The VIX is forming a bullish wedge and I am expecting a breakout to the upside or at least to the top of the wedge's channel. Obviously, this correlates with my bearish stance. The VIX also found support at the July 2008 high yesterday (Friday).


Now, the COMP, RUT, and SPX. All three have broken their uptrends. As the COMP was the first one to reach the 200-day, so shall it be the first to lead the decline, and it has. Some people say that the lack of volume has been an issue. If you noticed, we didn't get high bursts of volume in the beginning of any of the previous declines. We did get larger volume towards the end of the capitulation/exhaustion stages.

The most important market volume indicator is the COMP. Take a look at May 7th (red highlighted volume bar). This is the day that the COMP failed the 200-day MA, and it is also the biggest volume for the COMP in all of 2009. You may also notice that volume remained weak during previous declines. Price action should be your most important criteria when determining direction.


The RUT also has a pronounced breakdown, and it is very obvious. Currently flagging between 470-485, the RUT has the potential to reach the 50-day MA which should be above 450 in the coming days. There is major support at 470, so I do expect a lot of whipsaw on the daily.


Both indices are below both the 15- and 20-day SMA's, which is short-term bearish and serve as trend break confirmation.

Did you notice the "stick sandwich" 3-candle formations on the COMP and RUT? The textbook will tell you that it is a bullish pattern, but it is wrong. It's all about the location of it. The R-W-R (Red-White-Red) stick sandwich in my book is a continuation pattern to the downside (or if the candles were W-R-W, then bullish). If you need more examples of a stick sandwich, then let me know.

Finally, we come to the SPX, which is testing the 20-day. Of course, there is strong support at 875, a level which has acted as a barrier for months. So far, it is holding extremely well. The SPX's strength is the reason why I am not committed short. If we close below 875, then we could see a move to 840. We'll know if/when we get there.


As always, don't forget to exercise caution when shorting stocks.


Tuesday, January 6, 2009

TODAY'S ACTION

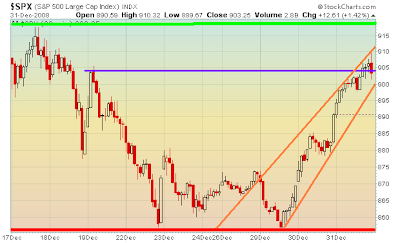
We're in a corrective phase as expected. We formed a doji which is typical and healthy for any normal consolidation. Notice how the market bounced off of major support at 920? So far, the charts say that we go higher. I'm not saying that we're going to go up in a straight and uninterrupted line, but I think we have enough juice for another breakout or two.

I would watch the VIX. We are extremely close to the very important long-term 200-day MA. The VIX is currently sitting at September support when the VIX actually flagged before the major breakout to 48. This suggests that the VIX will likely stay within a tight range between 35-45 for several days.

As for myself, I am up +10.87% for January so far. This is mainly due to massive double-digit gains from spikers/momentum plays. GMO, ZLC were held from Friday. CWST was sold. In addition, LVS, ARTC, FIG, and others were bought in the morning. These kinds of stocks are 1-3 day holds and then you just dump them or go short at the end of their runs. I already wrote a short primer on my Spiker strategy here on October 10th, 2008. It's not complete, but I am working on creating a "cheap tricks" manual.

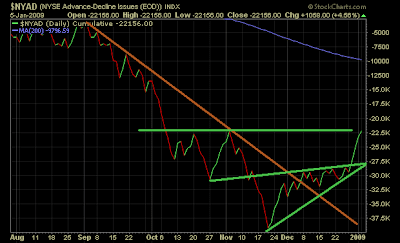
I've mentioned many times in the past that breadth must improve to support a market's rally. New Highs & New Lows for the NYSE ($NYHL) and the NASDAQ ($NAHL) have been net positive for a few days now. In fact, this is the longest streak for the NYSE since May and the longest for the NASDAQ since August. Today, we made 21 new highs and 8 new lows (a huge improvement from the 22 new highs and 4,320 new lows made on October 10th 2008!) . The Advance-Decline lines ($NYAD, $NAAD) also confirm the rally.

This consolidation area is critical. 920 SPX is obviously THE support level. What we don't want to see are breakdowns from conslidation like we've seen many times in the past (Just look at the trading range we've been in since December 8th. I would use a 920 SPX and 20-day MA combo as guides for any significant upcoming bounces. As long as the SPX stays above 920, the bulls are in full control.


SPX 5-day

SPX 10-day

SPX 40-day

SPX 5-month

Don't forget to try the Free Trend Analysis. It's FREE, so give it a shot!

Wednesday, December 31, 2008

HAPPY NEW YEAR!!!

Happy New Year!

This year was the year that defined “smart money” and “dumb money”. There was very little “in between”. This year was also a year full of the unexpected. Complete shockers. Who would have known that all of this stuff would happen?

The only way to trade was to expect the worst…even when we didn’t know how bad it could get. I remember pulling all-niters on Sundays in October, just because I knew something would happen! I’m sure many others had sleepless nights.

I am also sure that many people who have their money managed by a mutual fund or a shitty hedge fund may want to re-think where they invest. The biggest investment should be in yourself through education. You are the master of your money. I met my target of reading over 100 books this year. I read 113. What’s your target for 2009?

The fact is, I turned 24 just last month and I made north of 265%, my best year ever. I made a killing in CWST to cap off the year (just ask my students). I have an I.Q. of about 120, so I’m not a genius, I am just an average person. In fact, I failed Calculus I the first time I took it. The point is, anyone with the right mindset can become a successful trader – yes, even in the worst crisis of our generation.

I am glad that I finally stepped up to the plate to create this blog for the many readers who did want to learn about technical analysis, chart reading, and short-term trading. Going into 2009, I will make my best effort in presenting the technical picture of the market on a daily basis. I take pleasure in doing what I do best.

Below are the usual charts but also my predictions for 2009:


SPX 10-day

SPX 40-day

SPX 4-month

VIX 4-month
---------

The S&P 500 will re-test the 750 lows in the first half of 2009, and we will close below 700 by the end of 2009. This bear market will not end in 2009.

Crude oil will stay below $75/barrel for all of 2009.

Gold will break out above $1100/oz.

The VIX will hit 100 for the first time ever.

Posted unemployment will hit 10.5%. Total Unemployment (U-6) will hit 20%. The Employment Diffusion Index will hit the teens.

Commercial real estate values will drop 30-40%. Land development, office space, warehouses, shopping malls, hotels, and resorts will do the worst. Large multi-family properties will do the “best” because they will house all the folks who will lose their homes.

20% of retailers will file for Chapter 11 bankruptcy.

The bailout money will run out and the Fed/Treasury will request an additional package…and be denied. This debate will drag on for weeks and weeks.

Numerous local municipalities and/or states will go bankrupt. Many states will be unable to pay out full unemployment benefits.

The U.S. will be involved in another war.

A major terrorist attack, economic/financial, and/or political crisis will hit the U.S.

Martial law will be declared and FEMA’s Executive Orders 10990-11921 will be activated by the President. Military units will be deployed on the streets of America. The UN will continue to ship large numbers of military vehicles to the US mostly via Port of Beaumont, TX. There will be a massive build up of military equipment.

----------

Ok, maybe not the last one, but you get the idea. I don’t see how our bear market (in the worst crisis since the Great Depression) can last for only 2 years. The tech bear lasted for more than 2 years and that didn’t even involve a global credit crisis! Bulls should not get too comfortable in 2009. There will be disappointments.

I think this will once again be a trader’s market, rewarding those that are nimble. Join me in battle next year and let’s slay this motherfuckin’ dragon and make some serious money!

P.S. Have fun tonight and tomorrow and try not to get into a situation where YOU’LL need a bailout!

Tuesday, December 23, 2008

TODAY'S ACTION

It's going to be really quiet today. We have a half day today, which means that we close at 1:00PM. We have several economic reports coming out in the morning (not that they even matter these days): Durable Goods (8:30AM), Personal Income/Outlays (8:30AM), Jobless Claims (8:30AM), and don't forget that we have the EIA Petro report (10:35AM) and the EIA Nat Gas report (12:00PM) coming out on the same day. Could be volatile for you oil/gas folks.

The markets have been very quiet, just drifting down in an orderly fashion. We did break the November low trend line but before I go crazy on the short positions, I'll need comfort knowing that we're going to breakdown below 850 on the SPX (see SPX 35-day). We could be trading in a range, however a breakdown will kill the chance for neutral bound trading. This confirmation should come either today or Friday.

Glancing at individual sectors, I'd have to say that materials, industrials, financials, technology, and consumer discretionary look weak as hell. Utilities, energy, consumer staples appears to be neutral (going on to becoming weak). Healthcare is still doing the best (not breaking out or anything, but consolidating). In addition, sub sectors such as retailers and home builders look like they're about to fall off (ex. BZH, HOV, JNY & LIZ - already off).

Here's the problem with the rally: it's taking too long and the set up is breaking down. Obviously, the market is running out of steam and it doesn't matter if it's a holiday week. Many traders have withdrawn from the markets, including the big money, and there's simply a lack of interest in the market as evidenced by multi-week trading on lower and lower volume.

Likewise, the VIX reversed, even if it was 1%. Yesterday's action created a 4th tail and suggests more room to the upside if the VIX penetrates above the 100-day MA. Watch the VIX carefully, even though it's kinda busted. Watch the 45-46 level.

Let's see what happens. If I were you, I'd spend all of tomorrow going shopping for those 50-80% discounts. All-niters are not just for desperate students anymore. It's typically not worth trading on Christmas Eve.


SPX 1-day

SPX 3-day

SPX 5-day

SPX 10-day

SPX 35-day

SPX 5-month

NASDAQ 5-month

DJIA 5-month

VIX 5-month

Don't forget to try the Free Trend Analysis. It's FREE, so give it a shot!

Monday, December 22, 2008

TODAY'S ACTION

I'm sick of these last half-hour shenanigans, but this time it was different. I actually expected this it, because the market was at it's lower range during 12/12 - 12/16 when the market formed a double bottom. This is an example of how charts can provide some value in anticipating pullbacks and throwbacks and possibly, the dreaded "WTF pattern".

WTF Pattern (noun): A technical pattern that usually occurs during the last hour or last half-hour or even the last 5-mins of any trading day. It doesn't care if you're a bull or bear. It is non-biased and only causes extreme agony and stress for the overnight holder. Toward the end of the day, traders sit at their trading desks bewildered and confused as to what just happened prior to the closing bell. This creates a nationally coordinated, highly audible response to the unusual action which begins with a "WTF!!!" and may continue with creative vulgarity to express uncontrollable anger and dismay (see SPX 1-day).

Besides the WTF pattern that occurred around 3:40PM today, we had a series of bear flags that actually did what they were supposed to do -- breakdown, making today a very easy day to trade. The 880 breakdown was a key shorting level because the market declined below the 12/18 V-bottom and 12/16's pre-Fed flag level. After that, the market didn't have much short-term support.

In addition, I stated that the VIX was forming tails at the 100-day MA and it may reverse. The VIX fell as low as 42.75, went positive to 46.69, but backed off in the last 20 minutes (WTF). This is the 3rd tail on the VIX.

Right now, it looks like we are closer to forming a bearish wedge than an ascending triangle. It appears that both sellers and buyers are exhausting themselves (notice extremely low volume today). Many sellers sold a while ago and buyers don't really have the buying power (they can't even buy Christmas presents), therefore, we're stuck in this slow and boring tape which I'm sure is driving some people mad. The market will stay rather quiet this entire week as more people look forward to their Christmas festivities rather than risk losing more money. For most people, they'll be glad that 2008 is finally OVER.

Look at 10-day & 45-day charts of the SPX for support/resistance levels and actually write them down. It's easy to forget about them while you're on the battlefield. Knowing these key levels helps prevent panic selling or impulse buying. You'll also be aware of why and where bounces occur so you're not caught off guard. This is true, unless you get hit by the WTF pattern in which case you'll only have seconds to react to the idiotic program trading and/or manipulation.

I just realized that the ProFunds Group, parent of ProShares, is only 19 blocks away from where I am. Many people seem to be dissatisfied with their 2x ETFs. After I sell my holdings, if you'd like me to drive by and throw Molotov cocktails at the building, let me know.

Anyway, we're at the 12/12 - 12/16 lower range, but we're also sitting on top of the 30-day MA. The market could continue this rally for a short period of time until it hits 875 (20-day MA), 880, and maybe even 890 (50-day MA). After a bounce, if the SPX drops below 860, we would have formed a lower high which will confirm a bearish wedge pattern. For the market to burst through 920, it will probably require a catalyst greater than the Fed's rate cut, or maybe Santa coming to town would just do. In any case, the market is running out of time and it will soon make a decision with or without you.


SPX 1-day

SPX 3-day

SPX 5-day

SPX 10-day

SPX 45-day

SPX 3-month

DJIA 3-month

NASDAQ 3-month

Russell 2K 3-month

VIX 6-month

Don't forget to try the Free Trend Analysis. It's FREE, so give it a shot!