Showing posts with label Sentiment. Show all posts

Wednesday, June 24, 2009

MARKET COMMENTARY (6-23-09)

Today's action depends entirely on the FOMC's announcement. The market will spike up or down intra-day and you will have only minutes, if not seconds, to act. It is imperative that you have your watch lists (long and short) prepared and ready to go.

I am still leaning towards the bearish side, despite the fact that I remain in 100% cash. I took a poll a few hours ago asking traders how the market will act today, and here are the results:


As a group, this only means one thing: indecision. It will be obvious which side will win. Personally, the best option is to remain in cash until a clear direction is determined.

The SPX finds primary intra-day 10-pt support between 880-890 and 10-pt resistance between 920-930. There is also overhead resistance at 910.


Once again, I drew blank boxes for the remainder of June and all of July. Use your own imagination. I also included a weekly 7-year chart to put things in perspective:


Here are the COMP and RUT, both in precarious positions and threatening to further develop the head & shoulders pattern:


Finally, I look to the European indices (DAX, CAC, FTSE) for guidance due to the fact that they have broken down further than the US indices. Currently, Asia in the best shape.


Tuesday, January 6, 2009

TODAY'S ACTION

We're in a corrective phase as expected. We formed a doji which is typical and healthy for any normal consolidation. Notice how the market bounced off of major support at 920? So far, the charts say that we go higher. I'm not saying that we're going to go up in a straight and uninterrupted line, but I think we have enough juice for another breakout or two.

I would watch the VIX. We are extremely close to the very important long-term 200-day MA. The VIX is currently sitting at September support when the VIX actually flagged before the major breakout to 48. This suggests that the VIX will likely stay within a tight range between 35-45 for several days.

As for myself, I am up +10.87% for January so far. This is mainly due to massive double-digit gains from spikers/momentum plays. GMO, ZLC were held from Friday. CWST was sold. In addition, LVS, ARTC, FIG, and others were bought in the morning. These kinds of stocks are 1-3 day holds and then you just dump them or go short at the end of their runs. I already wrote a short primer on my Spiker strategy here on October 10th, 2008. It's not complete, but I am working on creating a "cheap tricks" manual.

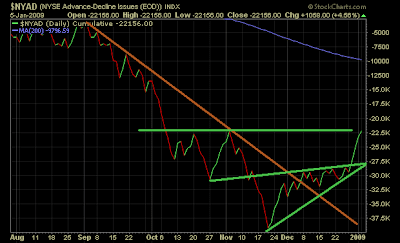
I've mentioned many times in the past that breadth must improve to support a market's rally. New Highs & New Lows for the NYSE ($NYHL) and the NASDAQ ($NAHL) have been net positive for a few days now. In fact, this is the longest streak for the NYSE since May and the longest for the NASDAQ since August. Today, we made 21 new highs and 8 new lows (a huge improvement from the 22 new highs and 4,320 new lows made on October 10th 2008!) . The Advance-Decline lines ($NYAD, $NAAD) also confirm the rally.

This consolidation area is critical. 920 SPX is obviously THE support level. What we don't want to see are breakdowns from conslidation like we've seen many times in the past (Just look at the trading range we've been in since December 8th. I would use a 920 SPX and 20-day MA combo as guides for any significant upcoming bounces. As long as the SPX stays above 920, the bulls are in full control.


SPX 5-day

SPX 10-day

SPX 40-day

SPX 5-month

Don't forget to try the Free Trend Analysis. It's FREE, so give it a shot!

Monday, November 17, 2008

WEEKLY TECHNICAL COMMENTARY

THIS WEEK’S ISSUE:
• Market Commentary: S&P 500 ($SPX), NASDAQ ($COMP)
• New-Highs/New-Lows, Advance-Decline Lines
• Gold ($GOLD), Crude Oil ($WTIC)
• This Week’s Economic & Earnings Reports

U.S. FUTURES (as of 8:50AM EST): DJIA (-0.82%), SPX (-0.88%), COMP (-0.56%)


MARKET COMMENTARY – INDU 8,497.31, SPX 873.29, COMP 1,516.85

I mentioned in a previous post on my blog that we have to cancel out Friday’s 4-5% loss today (with a 4-5% gain) and break through the 20-day MA within 3 days. This still holds true. The purpose of support is to become a spring board for the markets to attempt to head higher. However, if the market reaches its 4th attempt or greater, the chances of a significant bounce diminishes. Support isn’t supposed to be used that often and we can see many descending triangles form as a result. In addition, we need new and fresh buying pressure on the markets, but I don’t see where that will come from in the near-term. Many institutions are sitting on the sidelines (or lost it all) and many hedge funds publicly stated that they will remain in cash for the rest of the year. If hedge funds make (made) up 25% of the trading volume on the exchanges, then there is no other greater influence to buying and therefore a large, sustainable rally cannot take place without conviction. By observing the talking heads on financial news outlets, we may have a near equal division among bulls and bears. I want to note that a bear market cannot end unless there is 100% pessimistic sentiment ruling the markets and a complete sense of hopelessness. That level has not been reached.


What’s interesting is the divergence among all the indices. The Russell 2000 (not picture) is performing the worst of all indices. The NASDAQ is forming a diagonal neutral range or a wedge, but is threatening to break the lows as the 2nd worst performing index. The DJIA and S&P 500 are very similar, but they too are threatening their own lows. In the midst of all the technicals, let’s not forget the dire fundamentals of GM’s demise. The uncertainty surrounding that alone will prevent the markets from rallying.

NEW HIGHS-NEW LOWS, ADVANCE-DECLINE INDICES

Both the Advance-Decline and New Highs-New Lows lines have been declining during the time spent in the current neutral range. This suggests that we may have some serious problems coming if we keep hitting new lows. New highs remain only in the single digits out of tens of thousands of stocks. You can also see that the $NYAD is only one-day from breaching its low while the $NAAD has already breached and pulled back and will likely head lower. I provided a VIX update on my blog and that too suggests that the market may be heading lower given that the indicator is forming a bullish ascending flag.


GOLD & CRUDE OIL

There’s no question that oil is heading lower due to the numerous bearish flags that continue to form. I wouldn’t be surprised if oil hits the $40’s within 2 weeks. Unfortunately for oil bulls, this is a classic technical boom-and-bust pattern. Gold has been acting strange as everything in the world decouples. Gold is currently in a neutral range or symmetrical triangle; however you want to look at it. The fact is that gold can either spike higher or lower, even though its range is bearish. The chart is too unpredictable and therefore unreliable and will not give you too many clues as to where the next probable direction will be.


THIS WEEK’S WATCH

• A possible re-test of the Oct lows.

Noteworthy Economic Reports: Mon. (Manufacturing Survey – 8:30AM, Industrial Production – 9:15AM), Tues. (PPI – 8:30AM), Wed. (CPI – 8:30AM, Housing Starts – 8:30AM), Thurs. (Jobless Claims – 8:30AM, Leading Indicators – 10:00AM, Philly Fed – 10:00AM), Fri. (none).

Noteworthy Earnings Reports (planned): You can find at the complete list here: http://www.rightline.net/calendar/index.html.

Tuesday, September 23, 2008

1929 VS. 2008 - FINANCIAL HEADLINES


Bespoke Investment Group compiled a group of headlines for last week: "Someone once said that you can tell a story is really important when the Wall Street Journal runs the lead headline across the entire front page. Well this week, we didn't get one day where the headline ran the entire front page, we got five! Whether or not you agree with the various actions taken this week, remember as much of it as you can, because whatever the outcome, good or bad, people will be talking about this forever."

There are other recent headlines, such as the one in the most recent The Economist issue:


This all prompted me to find headlines that occurred in 1929-1932 and here's what I found:

Stocks Soar As Bank Aid Ends Fear of Money Panic
-- New York Herald Tribune, March 28, 1929
Banker Says Boom Will Run Into 1930
-- The World, March 30, 1929
September 1929
There is no cause to worry. The high tide of prosperity will continue”
- Andrew W. Mellon, Secretary of the Treasury

October 14, 1929
“Secretary Lamont and officials of the Commerce Department today denied rumors that a severe depression in business and industrial activity was impending, which had been based on a mistaken interpretation of a review of industrial and credit conditions issued earlier in the day by the Federal Reserve Board.”
– New York Times

Brokers to Open Offices on Ships (ARE YOU SERIOUS?)
-- The World, October 4, 1929
Public Liquidation Spurred by Bears, Hits Low Market
-- The World, October 20, 1929
Brokerage Houses Are Optimistic on the Recovery of Stocks - Brokers in Meeting Predict Recovery
-- The New York Times, October 25, 1929
Brokers Believe Worst Is Over and Recommend Buying of Real Bargains
-- New York Herald Tribune, October 27, 1929
October 29, 1929 - Stock Market Crashes! Here's a chart:
Gigantic Bank Pool Pledged To Avert Disaster as Second Big Crash Stuns Wall Street (sound familiar?)
-- The World, October 29, 1929
Stocks Up in Strong Rally; Rockefellers Big Buyers; Exchanges Close 2-1/2 Days
-- New York Herald Tribune, October 31, 1929

STILL OPTIMISTIC...

December 5, 1929
“The Government’s business is in sound condition.”
– Andrew W. Mellon, Secretary of the Treasury

Very Prosperous Year Is Forecast
-- The World, December 15, 1929

June 29, 1930
The worst is over without a doubt.
– James J. Davis, Secretary of Labor.

August 29, 1930
“American labor may now look to the future with confidence.”
– James J. Davis, Secretary of Labor.

September 12, 1930
“We have hit bottom and are on the upswing.”
– James J. Davis, Secretary of Labor.

October 16, 1930
“Looking to the future I see in the further acceleration of science continuous jobs for our workers. Science will cure unemployment.”

– Charles M. Schwab.

November 1930
“I see no reason why 1931 should not be an extremely good year.”

– Alfred P. Sloan, Jr., General Motors Co.


FINALLY SOMEONE SAYS IT:

January 20, 1931
“The country is not in good condition.”

– Calvin Coolidge.

June 9, 1931
“The depression has ended.”

– Dr. Julius Klein, Assistant Secretary of Commerce.

August 12, 1931
“Henry Ford has shut down his Detroit automobile factories almost completely. At least 75,000 men have been thrown out of work.”

– The Nation.


Rhea was RIGHT!:

July 21, 1932
“I believe July 8, 1932 was the end of the great bear market.”

Dow Theorist, Robert Rhea.

Thursday, September 18, 2008

WHAT AN INTERESTING DAY!


HOW ARE YOU FEELING TODAY?


All of the above?