We formed a force doji on a massive volume spike. I believe that we will see even greater spikes in volume. Typically, the doji is a 50/50 candle that basically shows the struggle between the bulls and bears. The volume was encouraging as it finally broke the tape's trend of dullness. We're no longer lolligag turtle fucking in this market. Excuse me, but I feel relieved of this.
Do I think the decline is over? No. I believe that this doji represents a pause in the decline. We'll see a short-term rally, but I can't imagine us shooting through the moon from this point on. That's ridiculous. We hit the technical 820 support level today, and that was the reason for the rally. Anyone who thinks that the banking crisis is all over because BAC just received this absurd bailout is a fool. We've been throwing hundreds of billions at this problem, but to no avail.
As for breadth, we made 173 new lows and 6 new highs. It is a deterioration of yesterday's NH-NL index, but it's acceptable given the bounce. We had a 2-to-1 advance-decline (A-D) line on the NYSE and a 1.5-to-1 A-D line on the NASDAQ. This is a typical reading for a doji suggesting that the bull/bear fight was a very close call.
If we gap up and stay up, we'll form a morning star reversal, a highly reliable signal, even if it's only for one more day. If we close lower, then it'll just be a continuation of the downtrend. Treat the doji as a meeting point, a battleground with a lot of idiotic confusion and indecision on both sides. A winner will be picked at the close later today.
Personally, I'd like to see some capitulation. Yesterday was not a capitulation day. The bulls do not have full control, and I would advise both sides to remain cautious. I personally have financial shorts that are hedged with FAS, so I could care less what happens tomorrow. Looking at several charts in a non-biased way, many stocks do exhibit reversal signals for the short-term.
We have CPI@ 8:30AM, Industrial Production@ 9:15AM, and Consumer Sentiment@ 10:00AM. In addition, we have earnings from BAC, C, SCHW, JCI, PPG and FHN.
Important levels (SPX): Support - 838 (Initial), 820 (Major) Resistance - 850 (Initial), 855, 862, 874
First, Moran e-mailed me his new rap vid on Madoff. I'm sick and tired of hearing about Madoff, but check it out:
Second, the breakdown has just begun. As long as we don't get a +250 pt day on the Dow, the shorts are fine. For now, the selling appears like it will accelerate. For example, look at the Dow and SPX's red candles and volume pattern. The open-close ranges are becoming larger and the volume is expanding on the down days. Subsequent larger candles make good waterfalls or cliffs.
If you recall from my post yesterday, this is enough to satisfy #1's "price/volume divergence". #3's band expansion has only just begun. Look at the July-August rally, because there's nothing funny about it. The similarities are astounding. You are crazy if you're net long.
Also, I've mentioned the significance of the financial sector this entire week. They are responsible for dragging this market down and I explicited stated many times that the market could not rally if the financials did not participate. If you were long, that's your fault. Citi is still screwed and BofA now needs more capital so they don't look stupid for spending only 2 days hammering out a $50 billion deal. Come on, it took you longer than 2 days to think about buying your sub-$100,000 house.
So the problem now is, "How will taxpayers, with their own money infused into these banks, be protected in the coming decline?". They won't. I suspect there will be a significant level of outrage once the public realizes they got duped. What's the Treasury going to do now, buy more stock? Please stop.
Today's action was boring/sideways because, by 2PM, I realized that we were forming a bear continuation flag for tomorrow's set up with a range between 820-860. I was right. We need a 5+ pt gap down on the SPX tomorrow morning for the flag's fulfillment. I am not covering my financial shorts until there is capitulation on massive volume. I am also considering shorting REITs as many of them show signs of topping out and ready to roll over.
I also mentioned breadth for several days now, more specifically the $NYHL & $NAHL and less so the $NYAD & $NAAD. Not only did the New-Highs/New-Lows indices turn red, we can now visibly see them turning down. Not only that, keep in mind that the only time we turned green was right before the crash. We formed 96 new lows and 4 new highs today and I suspect it will not get any better for the short-term. As for Advance-Declines, we had 1-to-10. It's been over a month since we've had these kind of internals.
As for the NASDAQ, they're going to have some problems tomorrow pending reaction from the AAPL news. In other news, Jim Goldman is an idiot. Sometimes the truth hurts, but you don't withhold it from the public. He's my "Asshat of the Month" nomination - you don't have to wait until the end of the month for this one.
Pwnd.
You can't ignore the fact that fear is coming back into the markets. I sense panic selling once again. The best sector to short is obvious the financials. Watch for a possible bounce at 820 SPX. Resistance is at 860 SPX. Watch C, BAC, JPM, and the rest of the financials very closely as well as a potential bounce off of the VIX at 54-55.
On a side note, beware the next several days. There is something evil in the air. This is beyond "WTF". I'm not bullshitting on this one. There will be a pretext.
I was twittering all day that we were forming a symmetrical triangle, then an ascending triangle. The breakdown of the triangle set off a cascade down from 12:30PM to 2:00PM. And then, from 2:30PM till 4:00PM, many people got mauled. It is a fact.
Just when you thought that the market was going to breakdown at 3:00PM, you got screwed. The movement in the last hour was definitely impressive, nothing short of a spectacular come back. It made you say "WTF?!", didn't it?
The only trades I made were closing out positions in the morning. It's typically not good to trade on doji days also known as tight-range indecision days marked by very little volatility. Doji tell you that the bulls and bears fought all day long, and neither side could best the other. The market could go 50/50 from here. I did not trade all day long because there was no edge. Did you see one?
We are very close to 857-860 once again. In addition, all three 20--, 30, and 50-day MA's are above the SPX, no doubt going to make the SPX's rally attempt laborious and very irritating. The downside is not that far, in fact, a breakdown is waiting only about 12-15 pts below. Watch the charts, they'll tell you where YOU need to be.
SPX 1-day
SPX 5-day
SPX 40-day
Here's a very important observation I made today. Below is a 3.5 month chart of the SPX right now. Below that is a chart of the SPX from 06/08 - 09/08. See any similarities?
1) Price/Volume Divergence - The rally heads higher, but volume isn't sustained. Here is where volume will be important. Once the range is broken, a burst of volume should be present.
2) 50-day MA Churning - Churning is the equivalent of "hanging out". In this case, the SPX has repeatedly made numerous attempts to rally on both charts, passing and failing over and over until the MA could no long support the market.
3) Bollinger Bands - The BB's are currently at their narrowest levels since the August-September rally. The market was in an approx. 50 point range before a major move occured (down). The market right now is in an approx. 87 point range. The more narrow the bands, the more explosive the future move.
4) V-Spike Bottom - Look carefully at both charts and compare their rallies since the first long white candle and it's trek upwards. It's similar enough to not ignore.
Keep these things in mind. I'm not saying it's going to be this way, but it's nice to know, right?
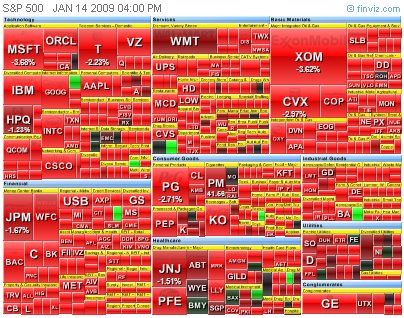
Looks like the financials led the market. Down. As much as traders want to be all gung-ho long and everything, it's important to keep an eye on the weakest sector. Take a look at C, JPM, WFC, BAC, and many smaller names. They all broke their uptrends. C, especially, formed a breakaway gap down on large volume. These types of gaps make it extremely difficult for a stock to recover in the short and intermediate-term.
So, what's been doing fairly well long-term? The utilities, because they haven't been going anywhere. Other sectors such as the materials, industrials, consumer disc. & staples, among others, are threatening to break down. Yesterday, I mentioned that the market cannot rally without the financials. This remains true. The overall health of the market depends on this sector. In addition, we started making more new lows than highs. The $NYHL and $NAHL are negative once again.
As for index breakdowns, the DJIA is leading the decline, followed by the SPY, R2K, and the COMP. The important matter is how the market is churning at the 50-day MA. This has been going on for over a month now without much progress at this key intermediate support level. Usually, you want to see the market use the 50-day MA as a "springboard" to propel itself higher. It is presently not the case.
We still have one major support level at 855 to clear before we start a multi-day decline. The focus continues to be on the financials, especially C (and JPM on the 15th). The trend is intact until it isn't. The financials have broken their trend and it appears that the market will follow for now.


 As for breadth, we made 173 new lows and 6 new highs. It is a deterioration of yesterday's NH-NL index, but it's acceptable given the bounce. We had a 2-to-1 advance-decline (A-D) line on the NYSE and a 1.5-to-1 A-D line on the NASDAQ. This is a typical reading for a doji suggesting that the bull/bear fight was a very close call.


 If we gap up and stay up, we'll form a morning star reversal, a highly reliable signal, even if it's only for one more day. If we close lower, then it'll just be a continuation of the downtrend. Treat the doji as a meeting point, a battleground with a lot of idiotic confusion and indecision on both sides. A winner will be picked at the close later today.