Next week, I would wait for a pullback before getting serious on the longs. Why? Because it's at the pullback where the market tests it's strength. It also gets rid of the weak hands. If the market breaks down, then you have nothing to worry about..you weren't in it. Likewise, if you missed the move the past few days, the market will give a second chance for entry at the pullback.
The targets for the pullback would be at 920, and/or wherever the 20-day MA ends up meeting the market, and finally, at the 50-day MA (if it gets to that point). Did you notice the 20-day/50-day MA crossover? It's lagging confirmation for a short-term bullish move. In addition, the market's neutral range narrowed the bollinger bands that is setting up a squeeze. Watch the upper band expand.
Take a look at the steepness of the 3-day uptrend on the 30-day chart. The purple area shows the likely consolidation area. Many people want to see the market go up, up, and away! However, consolidation marked with down days are necessary and a part of the trending process. The rally continues until the trend changes.
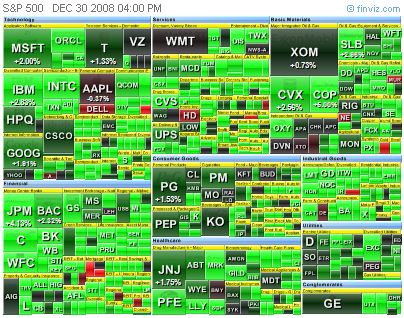
Almost everything did very well today, except for the REITs. If they can't participate on a +3% day in the market, then they have problems (maybe people realize that many REITs will get crushed this year). On an interesting note, retailers did very well today, which is confusing with what I just said about commercial RE. Many retailers must fail before REITs fail because store closures cut into the REITs NOI and the ability for them to fulfill their debt service.
Yesterday, I briefly mentioned 12 indicators, so I'll describe what they are and how to use them below the usual charts. This is a bear market rally so don't expect this uptrend to continue forever. Many indicators say that the market is overbought, but remember that the market can stay overbought or oversold for extended periods of time. Trade with the trend and keep an open mind as we cautiously climb this Wall of Worry.
 SPX 30-day
 SPX 6-month
 REITs stood like like a sore thumb.
12 Common Technical Indicators
1) Relative Strength Index (RSI) - The RSI is a momentum oscillator that shows overbought/oversold conditions. Typically, if a stock falls below 30, it is oversold. If a stock rises above 70, it is overbought. In addition, a stock rising above 30 is bullish and a fall from 70 is bearish.

 3) Commodity Channel Index (CCI) - The CCI was created for commodities, but it used for everything now. It is a cyclical indicator. The primary purpose of the CCI, for myself, is to confirm reversals. A move above +100 indicates overbought and a move below -100 indicates oversold. Just like MACD, a divergence can give additional clues to a pending reversal.
 4) TRIX - The TRIX is a momentum oscillator that measures the rate-of-change of closing prices of a stock. For longer time periods, if the TRIX moves above o, it confirms a uptrend and a move below 0 confirms a downtrend. TRIX crossovers also give buy/sell signals. If the TRIX crosses over the signal line (the 9-day MA in red), it is a buy. If the signal line crosses over the TRIX, it a sell.
 5) Force Index - The Force Index was created by Alexander Elder, the author of Trading for a Living, and it is used to determine if the trend is getting stronger or weaker. It is a price/volume oscillator. Buy signals are generated when the Force Index crosses above 0 and sell signals are generated when it crosses below 0. A sideways movement shows a possible trend change.
 6) Slow Stochastics - The Slow STO is a momentum oscillator that indicates overbought and oversold levels. Typically, anything below 20 is oversold and anything over 80 is overbought. I'm not writing out the calculations for the %K (black line) and the %D (red line), but just know that if the %K crosses over the %D, it is bullish and if the %D crosses over the %K, it is bearish.
 7) On Balance Volume (OBV) - I've mentioned that volume precedes price action several times. The OBV was created with that in mind. It basically adds volume when the price is up and subtracts volume when the price is down. This creates the line. A OBV line that is heading up means that there is more volume on up days. The opposite is true for down days. With many other indicators, a divergence between price and the OBV may signal a pending reversal.
 8) Money Flow Index (MFI) - The MFI is a RSI that is more volume-weighted that shows positive or negative money flow. Just like other indicators, it can measure overbought (80)/oversold(20) levels. If the MFI is trending down, but the price is higher, the stock may reverse. The opposite is also true.
 9) Rate-of-Change (ROC) - The ROC is a momentum oscillator that simply measures day-to-day (or period-to-period) change, therefore it is one of the more "choppier" ones. If the ROC moves above 0, it is a buy signal, and if it drops below 0, then it's time to sell. Any divergences between the ROC and price should be paid attention.
 10) Williams %R (W%R) - The W%R is similar to the Stochastics and it shows overbought/oversold levels. A reading below -80 is oversold and a reading above -20 is overbought.
 11) Accumulation/Distribution (A/D Line) - The A/D line is similar to the MFI and OBV, but the calculations are different (you can look it up yourself). The best use for A/D line is to confirma move or identify a divergence.
  12) Average Directional Index (ADX) - The ADX confirms the strength of a trend. The +D1 is the positive directional indicator (green) that measures upside force, the -D1 is the negative directional indicator (red) that measures downside force, and the ADX is the black line. The +D1 and -D1 are self-explanantory and the ADX is most useful when a divergence can be identify over a longer period of time.