We have the big one tomorrow, and it won't be pretty. Last month's reading was -533K lost, but this time it's -500K with a range of -750K to -300K. Whoever thinks we lost only 300K jobs is living in a cave. In addition, unemployment (currently at 6.7%) is expected to be at 7% with a range of 6.8% to 7.1%. In each of these cases, the Street expects both numbers to come in at the higher end. I know I do.
Let me remind you folks that real & total unemployment is at 12.5%, the highest since 1994 (BLS doesn't allow me to go beyond that). Don't let the 6.7% foll you.
We formed some possible reversal signals in the broad market today. The DJIA and SPX both formed hammers while the COMP formed a bullish piercing pattern. Both the DJIA and SPX bounced off their 50-day MA and the COMP bounced off it's 20-day MA. In addition, these bounces keep the uptrends in tact. Keep in mind that they all have the 20, 30 & 50-day MA's right below their 50% retracement level. Be aware of all the support, resistance, and trend lines before you freak out tomorrow.
Overbought as suspected. The 920 breakdown was my sell point for my long ETFs and that initial gap down really did it this morning. Luckily, I did manage to pick up some FAZ on the 2nd breakdown. Then, 3:00PM and beyond looked like it was forming a double bottom, so I got some FAS to hedge it. In the end, I made enough to buy a damn Chick-fil-A sandwich. Not bad considering the fact that today was stale, lifeless, dull, ho hum...whatever you want to call it.
There are hardly any spiker plays remaining. They usually come all at once in a 1-3 day blitz and then they either consolidate or turn into possible short candidates like FTK, APL, IVN, or NCX. If you noticed, all the stocks that jumped 50-100% were all cheap $1-5 shit stocks. It's kinda scary that they are the biggest gainers in the market. The strength of a rally is determined by it's leaders. Stuff like ACAS, FIG, MNI, ARTC, APL, MEA, AER, XTEX, DFT, GLS, KWK, AHD, GFIG, KFN, ARM, IO, and VCI are NOT leaders.
On another note, unbeknowst to me, I was following over 1,600 twitterers that included strippers, pornstars , self-proclaimed psychics, Bernie Madoff himself, "hotliquidsex" (+ a dozen other IDs starting with "sex"), "the_boob_nazi", and others who obviously didn''t create a healthy trading environment. Therefore, I cleaned out my Twitter account so if I accidentally "unfollowed" you, kindly let me know.
I ran my fibs and noticed that we are now at the 50% retracement from the rally's peak to trough (so far). We could have a volatile indecision day tomorrow due to the depth of the correction as well as our proximity to short-term oversold levels. 920 has once again become overhead resistance, the same level that took nearly a month for a breakout to occur. This level was penetrated without any trouble right at the open.
Even though a low volume sell-off is not as bearish as one on high volume, we can see instances from October-November where the market rapidly sold off on low volume anyway, regardless of what traders thought. In addition, we are no where near full market participation yet. Not even close. Use volume to confirm price action, not the other way around.
Also, look at the 4-month chart, we are still in a wedge! Just as we thought we left the wedge, we're actually in an even larger one, so be aware of it. Because of the continuation and duration of the wedge, I have to believe that we are going to breakdown sometime soon. Look at the short-term cup forming since December 15. It is attempting to create a handle. Watch that too.
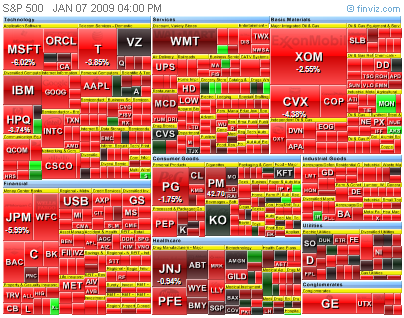
Sector analysis indicates that the financial sector is, by far, the weakest. The materials come next. So far, everything else is maintaining their uptrends. As for breadth, there were 0 (NYSE) and 7 (NASDAQ) new highs and 7 (NYSE) and 1 (NASDAQ) new lows. This broke the positive streak we've had for four days (look at the $NYHL & $NAHL). We were doing really well too.
Tomorrow, we have the usual jobless claims (8:30AM - Consensus: 540K), chain store sales, and the Monster Employment index. Check out all the states with system crashes/delays due to overwhelming claims: NE, NC, NY, MI, VT, FL, HI, OH, TN, KY. There are more, but I don't want to frighten you. We have some major problems coming our way...
As for earnings we have PSMT, MTRX, FCSX, and RPM pre-market. We have SCHN during market hours and APOL, HWAY, LWSN, and RBN after-hours. There are a few microcaps mixed in, but they're still nice to know.
Lastly, I have to give credit to Danny and Woody for staying short, despite the relentless uptrend that would have induced any weak short seller to jump in front of a train. Ya'll got some brass balls. Congrats!
I was watching Carmen's "On The Money" show just now and realized the seriousness of the lack of financial education that the average American possesses. It's scary. People are relying on advisors and money managers. Chances are, if you have to go to these people, you're wealthier than them. I don't understand why wealthy people go to people who are not for "sound" financial advice. It still boggles me. Many (not all) are the same folks that dropped the financial industry to its knees. This is why I stress self-education. No one cares more about your money -- than you.
These spikers sure are a great way to start off 2009. I am up +19.2% for the month/year and I have/had stuff like ACAS, ARTC, FIG, GFIG, FTK, and others to thank. Days like yesterday and today do not come often, and usually by the time these stocks are "discovered", it is time to short. Many names have become so extended that they are now completely outside of their upper bollinger band. I am looking for a bearish gap up/down or a doji to form to execute short trades on the very same names that made me much coin on the long side. Don't chase during the late stages or, you'll get face fudged.
As for the broad market, we are still consolidating and we are, indeed, short-term overbought. The more consolidation days that we have (while maintaining the 920 level), the better. Why? Because it relieves the overbought situation and brings many of these indicators back to the mean. Volume is still picking up, but we are not at "normal" levels yet. Also, notice the 2nd doji on the 4-month chart. That's normal. It is possible that we could be testing the 920 level again, so be prepared for that.
On a different note, I think some of you still do not know how to use my charts. You are an idiot, because I've explained too many times. Let me give you a lesson that even my 8 year old cousin could understand. The charts are used for 1) identifying support/resistance levels to anticipate the next day's bounces (so you don't become the idiot that panics and sells/covers), 2) identifying possible reversal/pivot points via divergences (so you don't get caught with your pants down), 3) identifying entry/exit points for future trades (so you don't get killed 5 mins after you place a trade), among others. Don't be a dumbass, try to look beyond the obvious, captain.
We're in a corrective phase as expected. We formed a doji which is typical and healthy for any normal consolidation. Notice how the market bounced off of major support at 920? So far, the charts say that we go higher. I'm not saying that we're going to go up in a straight and uninterrupted line, but I think we have enough juice for another breakout or two.
I would watch the VIX. We are extremely close to the very important long-term 200-day MA. The VIX is currently sitting at September support when the VIX actually flagged before the major breakout to 48. This suggests that the VIX will likely stay within a tight range between 35-45 for several days.
As for myself, I am up +10.87% for January so far. This is mainly due to massive double-digit gains from spikers/momentum plays. GMO, ZLC were held from Friday. CWST was sold. In addition, LVS, ARTC, FIG, and others were bought in the morning. These kinds of stocks are 1-3 day holds and then you just dump them or go short at the end of their runs. I already wrote a short primer on my Spiker strategy here on October 10th, 2008. It's not complete, but I am working on creating a "cheap tricks" manual.
I've mentioned many times in the past that breadth must improve to support a market's rally. New Highs & New Lows for the NYSE ($NYHL) and the NASDAQ ($NAHL) have been net positive for a few days now. In fact, this is the longest streak for the NYSE since May and the longest for the NASDAQ since August. Today, we made 21 new highs and 8 new lows (a huge improvement from the 22 new highs and 4,320 new lows made on October 10th 2008!) . The Advance-Decline lines ($NYAD, $NAAD) also confirm the rally.
This consolidation area is critical. 920 SPX is obviously THE support level. What we don't want to see are breakdowns from conslidation like we've seen many times in the past (Just look at the trading range we've been in since December 8th. I would use a 920 SPX and 20-day MA combo as guides for any significant upcoming bounces. As long as the SPX stays above 920, the bulls are in full control.


 SPX 5-day
 SPX 10-day
 SPX 40-day
  SPX 4-month