Showing posts with label XLF. Show all posts

Thursday, March 5, 2009

MARKET COMMENTARY (2-4-09)

I am in over 90% cash, so I have no bias toward either side, long or short. The reason is because I see conflicting signals. A good example of a high probability reversal to the upside is GE on a gap up. However, if you look at the XLF, it's obvious that the financial sector will once again drag this market down. Financial volume has been weak for the past three days, which doesn't confirm a sustainable reversal and besides, look at the market carpet below. If you look at GE's volume, combined with oversold indicators, the hammer reversal, and the lower Bollinger bounce, then it's likely that GE will be up. See what I mean?

Instead of holding overnights, I elected to observe the open and see what happens in the first 30 minutes (as always) today. For bounce names, I am looking at the insurers, and possibly some cheapies including, but not limited to, PNX, RDN, FOE, HW, and MIC. It all depends on what happens in the morning for Spiker classification. In the event that we head lower, you might as well hit various financials since they are still the absolute weakest sector in the S&P. We are still in a neutral range (so far) and I'd like to see some quick multi-day decisive action take place.

I want to express caution here as we approach March 2nd's opening gap resistance (which was already tested yesterday). I will focus on the 724-735 zone as overhead resistance. I won't short much unless we breakdown from the flag, but at these levels, it is too dangerous to short in large amounts. It is also dangerous to go considerably long. Personally, I found no reason to trade yesterday (as a primary swing trader), so I watched a movie (
Running Scared), and caught up on reading my first non-financial book in 2009: The Audacity of Hope by the "O-Man". Unfortunately, I cannot trash the book because it was a gift from mom.


We have jobless claims at 8:30AM. The consensus is 650K, with a range of 600K to 676K. The previous actual level was 667K.

Don't forget to try the Free Trend Analysis. It's FREE, so give it a shot!

Wednesday, January 21, 2009

TODAY'S ACTION


Yes, We Can...drop -332 points! heh heh...congrats to our new President. I would have gone to the Mall, which is only minutes away, but decided not to because 1) I had a good amount of money at work since Friday, 2) it's 20 degrees in DC these days, 3) I had to coach my students, who also made profits on a shitstorm day. Besides, why not watch the Inaguration on your favorite financial network in your heated office? Exactly.


What's great about charts is that sometimes you know immediately when you are right or wrong and if you should add or reduce positions. Today was one of those days. I'm not going to bs: I was slightly questioning my decision to hold my short positions on Friday. That was normal given the power rally that occurred end of day. The rewards for those who held shorts over the long weekend were immediately realized and it was a major day to make a killing. I am personally up a ridiculously large amount and I regularly use the same charts I post here for intraday guidance.

What do I mean by guidance? The first things you should note are the key support/resistance levels, any moving averages or fibs (if any), and price/volume action. When you are trading the next day, you should be keen enough to discover that these "magical" lines and stuff actually do work, despite that fact that I just made TA sound like Tasseography. Sometimes, in the heat of battle, it's easy to forget the key technical levels because emotions are running so high. This is why I encourage people to actually write this stuff out. It only takes a few seconds and it could save you thousands of dollars.

Today was an important day. I needed the market to close in the red to support my short bias. I didn't need a -5% down day, but I'm not complaining. We took out the key levels I mentioned yesterday, especially 820 SPX. The Dow broke and closed below the 8,000 level. This level is not necesarily a major technical level, but it's more of a psychological level (remember when we broke 10,000? Pure chaos). The COMP and R2K both failed the 50-day MA and all 4 indices are in comfirmed downtrends. There is no reason to be an a-hole dip buyer here.

For weeks now, I've told you guys to observe the financials, the weakest sector in the S&P. They made a new low today and they won't hesitate to bring the indices back down to test their own respective lows. The only time where someone should be long in this situation is if the financials stem the decline with capitulation and rally on a highly reliable reversal on massive volume. Until then, the bleeding will continue as the fear continues to permeate the markets and people sell stocks like it's going out of style.

Right now, I'm going to ride this downtrend until the wheels fall off regardless of whatever small bounces occur during this descent. I am up +64% YTD thanks to 1) going long spikers, 2) going short financials, and 3) my tea leaf readings.

In other news, this idiot finally quit.


SPX 3-day

SPX 5-day

SPX 10-day

SPX 50-day

SPX 4-month

XLF
Don't forget to try the Free Trend Analysis. It's FREE, so give it a shot!

Saturday, December 20, 2008

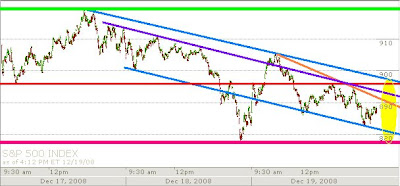
FRIDAY'S ACTION

There is nothing new except that we are close to bursting out either up or down. I am guessing that some movement will occur ahead of Tuesday's 8:30AM GDP report. The consensus is -0.5% with a range of -0.8 to -0.5. The previous reading was -0.5%. I don't know how the consensus could remain the same as Q3, but whatever, everyone expects negative growth.

We also have Consumer Sentiment, Existing and New Home Sales (all three @ 10AM). The U. of Michigan sentiment index is expect to come in at 58.6 with a range of 53.6 to 60.2. The previous reading was 59.1. Existing home sales are expected to come in at 4.9M with a range of 4.750M to 5.04M. The previous reading was 4.98M. New home sales are expected to come in at 420K with a range of 360K to 490K. The previous reading was 433K.

Back to the charts. If we breakout then we formed an ascending triangle. If we breakdown, it's a bearish wedge. Looking at the 45-day intraday charts, a major move is most likely going to happen before Christmas given the lack breathing room at the end of the triangle/wedge.

The Dow appears to be the weakest. The Russell 2K is the strongest while the S&P and Naz remain 'neutral'. As for the moving averages, the Russell 2K is above, the Naz is sitting right on top, and the S&P and Dow are both below it. All four indices are bound by the 20-day and 30-day MA's in some way.

Looking at the VIX, we formed a 'hammer' candle, which is usually a reversal, but confirmation is needed. Upon layering it, the VIX is sitting right at the 100-day MA. The VIX tested the 100-day MA on Thursday and on Friday, the VIX managed to recoup most of its losses (notice the tails on both days). We "may" see an upside reversal on the VIX on Monday.

As for sectors, healthcare is the strongest. Utilities remains neutral. All the other sectors have to move up quickly because they are a hair away from breaking through their respective lower trendlines. The financial sector may be forming a head and shoulders. The industrial and technology sectors are forming lower highs (the tech sector technically broke down).

This entire month has been riddled with headache and a lack of reliable direction. I'm sure there was a lot of impulse trading going on. Once we break out or down, it will be easier to determine direction. Until then, traders have to either daytrade (very quickly) or sit tight and be patient (remain hedged), or remain in cash. Use the MA's and support/resistance as your guides.

For the 45-day intraday charts:
-the blue line is the 50-day MA (325p.)
-the green line is the 30-day MA (195p.)
-the pink line is the 20-day MA (130p.)

SPX 1-day

SPX 3-day

SPX 5-day

SPX 10-day

SPX 45-day

DJIA 45-day

COMP 45-day

Russell 2K 45-day

VIX 6-month

SPDR Select Sectors

Don't forget to try the Free Trend Analysis. It's FREE, so give it a shot!

Monday, December 8, 2008

WEEKLY SECTOR PREVIEW

With the exception of energy, every sector is exhibiting bullish short-term signals. I said short-term because anything beyond that is indeterminable given the ever growing uncertainty in the financial markets. Volume is rising for many of the sectors, especially on the up days, and many have also broke out above the 20-day MA. A confirmation up day is needed for a safer, low-risk entry. This confirmation day will also be marked with large short covering. Any days from here on out should be marked with higher and higher volume. Energy is a lagging sector, but I believe oil will be up for a few days to follow the market leaders. The initial target is the 50-day MA, where an initial failure is more than likely.


Don't forget to try the Free Trend Analysis. It's FREE, so give it a shot!

Sunday, November 30, 2008

WEEKLY SECTOR PREVIEW

We had a very quiet, low volume week, but the reason why last week was so important was because it could be a set up for a nice opportunity for shorts. We’re still very much neutral with consumer staples, energy, and health care being the most neutral sectors. The financials, materials, consumer discretionary, industrials and tech sectors appear to be exhibiting signs of a bear flag. The utilities sector is the closest to forming an uptrend from here. At the very least, we should expect a pullback. The financial sector shows the most promise for a successful short.

Keep in mind that we have various reports this week, including the all important Employment Situation coming out on Friday. Also, look out for a response from Black Friday’s sales figures and GM’s congressional hearing. All you need to note in the charts are the price/volume divergences in almost every sector and the nearest major support/resistance areas.


Don't forget to try the Free Trend Analysis. It's FREE, so give it a shot!