Monday, December 22, 2008

TODAY'S ACTION

I'm sick of these last half-hour shenanigans, but this time it was different. I actually expected this it, because the market was at it's lower range during 12/12 - 12/16 when the market formed a double bottom. This is an example of how charts can provide some value in anticipating pullbacks and throwbacks and possibly, the dreaded "WTF pattern".

WTF Pattern (noun): A technical pattern that usually occurs during the last hour or last half-hour or even the last 5-mins of any trading day. It doesn't care if you're a bull or bear. It is non-biased and only causes extreme agony and stress for the overnight holder. Toward the end of the day, traders sit at their trading desks bewildered and confused as to what just happened prior to the closing bell. This creates a nationally coordinated, highly audible response to the unusual action which begins with a "WTF!!!" and may continue with creative vulgarity to express uncontrollable anger and dismay (see SPX 1-day).

Besides the WTF pattern that occurred around 3:40PM today, we had a series of bear flags that actually did what they were supposed to do -- breakdown, making today a very easy day to trade. The 880 breakdown was a key shorting level because the market declined below the 12/18 V-bottom and 12/16's pre-Fed flag level. After that, the market didn't have much short-term support.

In addition, I stated that the VIX was forming tails at the 100-day MA and it may reverse. The VIX fell as low as 42.75, went positive to 46.69, but backed off in the last 20 minutes (WTF). This is the 3rd tail on the VIX.

Right now, it looks like we are closer to forming a bearish wedge than an ascending triangle. It appears that both sellers and buyers are exhausting themselves (notice extremely low volume today). Many sellers sold a while ago and buyers don't really have the buying power (they can't even buy Christmas presents), therefore, we're stuck in this slow and boring tape which I'm sure is driving some people mad. The market will stay rather quiet this entire week as more people look forward to their Christmas festivities rather than risk losing more money. For most people, they'll be glad that 2008 is finally OVER.

Look at 10-day & 45-day charts of the SPX for support/resistance levels and actually write them down. It's easy to forget about them while you're on the battlefield. Knowing these key levels helps prevent panic selling or impulse buying. You'll also be aware of why and where bounces occur so you're not caught off guard. This is true, unless you get hit by the WTF pattern in which case you'll only have seconds to react to the idiotic program trading and/or manipulation.

I just realized that the ProFunds Group, parent of ProShares, is only 19 blocks away from where I am. Many people seem to be dissatisfied with their 2x ETFs. After I sell my holdings, if you'd like me to drive by and throw Molotov cocktails at the building, let me know.

Anyway, we're at the 12/12 - 12/16 lower range, but we're also sitting on top of the 30-day MA. The market could continue this rally for a short period of time until it hits 875 (20-day MA), 880, and maybe even 890 (50-day MA). After a bounce, if the SPX drops below 860, we would have formed a lower high which will confirm a bearish wedge pattern. For the market to burst through 920, it will probably require a catalyst greater than the Fed's rate cut, or maybe Santa coming to town would just do. In any case, the market is running out of time and it will soon make a decision with or without you.


SPX 1-day

SPX 3-day

SPX 5-day

SPX 10-day

SPX 45-day

SPX 3-month

DJIA 3-month

NASDAQ 3-month

Russell 2K 3-month

VIX 6-month

Don't forget to try the Free Trend Analysis. It's FREE, so give it a shot!

Saturday, December 20, 2008

FRIDAY'S ACTION

There is nothing new except that we are close to bursting out either up or down. I am guessing that some movement will occur ahead of Tuesday's 8:30AM GDP report. The consensus is -0.5% with a range of -0.8 to -0.5. The previous reading was -0.5%. I don't know how the consensus could remain the same as Q3, but whatever, everyone expects negative growth.

We also have Consumer Sentiment, Existing and New Home Sales (all three @ 10AM). The U. of Michigan sentiment index is expect to come in at 58.6 with a range of 53.6 to 60.2. The previous reading was 59.1. Existing home sales are expected to come in at 4.9M with a range of 4.750M to 5.04M. The previous reading was 4.98M. New home sales are expected to come in at 420K with a range of 360K to 490K. The previous reading was 433K.

Back to the charts. If we breakout then we formed an ascending triangle. If we breakdown, it's a bearish wedge. Looking at the 45-day intraday charts, a major move is most likely going to happen before Christmas given the lack breathing room at the end of the triangle/wedge.

The Dow appears to be the weakest. The Russell 2K is the strongest while the S&P and Naz remain 'neutral'. As for the moving averages, the Russell 2K is above, the Naz is sitting right on top, and the S&P and Dow are both below it. All four indices are bound by the 20-day and 30-day MA's in some way.

Looking at the VIX, we formed a 'hammer' candle, which is usually a reversal, but confirmation is needed. Upon layering it, the VIX is sitting right at the 100-day MA. The VIX tested the 100-day MA on Thursday and on Friday, the VIX managed to recoup most of its losses (notice the tails on both days). We "may" see an upside reversal on the VIX on Monday.

As for sectors, healthcare is the strongest. Utilities remains neutral. All the other sectors have to move up quickly because they are a hair away from breaking through their respective lower trendlines. The financial sector may be forming a head and shoulders. The industrial and technology sectors are forming lower highs (the tech sector technically broke down).

This entire month has been riddled with headache and a lack of reliable direction. I'm sure there was a lot of impulse trading going on. Once we break out or down, it will be easier to determine direction. Until then, traders have to either daytrade (very quickly) or sit tight and be patient (remain hedged), or remain in cash. Use the MA's and support/resistance as your guides.
For the 45-day intraday charts:
-the blue line is the 50-day MA (325p.)
-the green line is the 30-day MA (195p.)
-the pink line is the 20-day MA (130p.)

SPX 1-day

SPX 3-day

SPX 5-day

SPX 10-day

SPX 45-day

DJIA 45-day

COMP 45-day

Russell 2K 45-day

VIX 6-month

SPDR Select Sectors

Don't forget to try the Free Trend Analysis. It's FREE, so give it a shot!

Thursday, December 18, 2008

TODAY'S ACTION

Today was the 2nd time I posted intraday on iBC! I even updated it twice because it was so boring until the meltdown hit. Let's start with a few things I stated:

1) "As long as this pattern holds, it is bullish..." -- the short-term pattern broke, therefore, it wasn't as bullish anymore. The odds have become about 50/50, without any great edge to one side.

2) "As long as we stay better than -1% down on the market, it remains in the control of the bulls..." -- the bears took control when the market fell past -1%.

3) Regarding the VIX: "There is support at 45, so watch yourself." -- the VIX hit a low of 44.50" and bounced. Don't say I didn't warn you. Gio is Master of the VIX.

4) "Bears...you guys need to drop this [market] way below 900 on the SPX and break this [market] in half" -- A 50% long/50% short hedge alert was produced right after a drop below 900 at 2:01PM. The bears broke the market down in "half" afterwards, which is now at pre-Fed levels (look at a 5-day chart).

There are always conditions/stipulations that need to be met as the market evolves. Any violations will change the entire picture and the odds, instantly. Most conditions above were not met, therefore, it was correct to be neutral 50/50 into the close. The reliability of the consolidation diminishes significantly if the correction exceeds the breakout day's halfway point. That's why I'm holding both FAS and FAZ until the time is right.

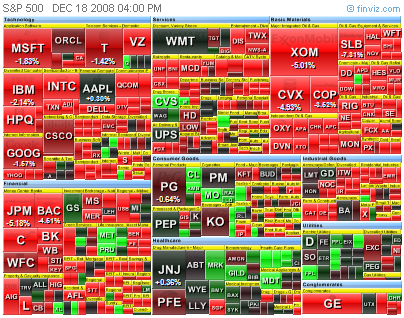
Who knew that an S&P outlook downgrade on GE could drop this market so hard? We had Jobless Claims, Philly Fed, various earnings, and everything else come out this week that didn't drop the market. Today is a day that reminded people to stay nimble in the face of continued uncertainty.

The 50-day MA is the single most important intermediate-term support/resistance level. This is starting to resemble the market's rally in August to the 50-day where it made two attempts and completely gave up. There could be several attempts here as we are not yet out of the ascending triangle/wedge as evidenced by the 10-day chart. Proceed with caution as that range is narrowing.

It now comes down to testing the 30-day and 20-day MA's. Right now, it basically comes down to: 1) the market MUST close green, preferably above the 50-day MA, or else the market will break it's uptrend (10-day chart). Also note that the auto bailout has not yet been resolved. Don't forget options expiration--quadruple witching tomorrow. It could be get crazy.

One thing to note that's pretty important is that the market WAS being led by #1 Financials and #2 Materials. Both sectors are no longer leading.

In other news, I obtained a high score of "17" in the fun game of hitting Bush with cheap Iraqi-made shoes. See if you can beat my ninja skills at SockandAwe.


SPX 1-day

SPX 3-day

SPX 5-day

SPX 10-day

SPX 6-month

VIX 6-month

Don't forget to try the Free Trend Analysis. It's FREE, so give it a shot!

Wednesday, December 17, 2008

TODAY'S ACTION

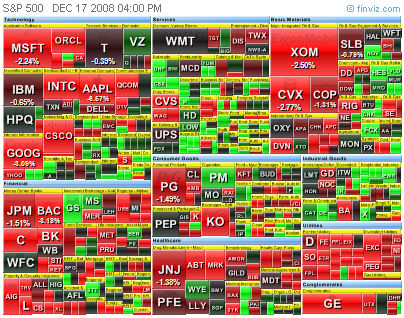
Yesterday was definitely a corrective day as evidence by the rounding cup in the morning. And then, after failing the near 920 level, the SPX dropped like 12 points and is now in a holding pattern. Technically, that's an intraday breakdown, however, if you look at a multi-day chart, it's a blip. We're back in the neutral range that formed since last Monday. Take a look at the 10-day chart.

We formed an "almost" inside day. I say "almost" because the entire day's range is not within Tuesday's range, but it's close enough. You can also call it a "spinning top", a candle with no bias toward either direction. Following large up moves, it's not uncommon to see a few spinning tops/doji before another move up. They are typically continuation patterns unless there's a major breakdown. This smaller-ranged days form the "measured move up" pattern.

What do I not want to see? A -2.5% day or more. In addition, if the SPX closes below 890, there is cause for concern. We must break out of 920 on SPX quickly (1-3 days) to keep the uptrend intact. On the 2-month chart, we can see that 920 has provided significant overhead resistance. Today was a test of see if the 50-day MA would hold up as support, and it did. As a result, the market is bound by both 920 and the 50-day MA (@900), creating a tight 20-point range. A major move is imminent.

As for the longer-term chart, the collective pattern can be summarized as either a 1) wedge, or 2) an ascending triangle. In my opinion, we're in an ascending triangle. If we break out and move past 940 on the SPX, then we would continue a wedge pattern. My initial target is 920 to break the triangle. 940 won't be as difficult to achieve.

As for the bears, the only chance they have is if the entire move on Tuesday is nearly cancelled out. Being up 360+ points and then correcting -100 points is not a reason to celebrate. A correction like that is normal, it's just a correction. If the market gave away half (or more) of Tuesday's gains, then bulls should get a little nervous because that would mark a total breakdown. If we correct subsequent days from there, the volume should decrease each passing day not to exceed the volume of the previous day.

I am anticipating additional upside movement. If we break out, volume should be equal to or greater than yesterday's volume. If we close below 900 on the SPX, then I'll have to hedge my long position equally. Enjoy the rally while it lasts, but like I mentioned before, be ready to bail out if things turn ugly. Flexibility is the name of this game. I know that many things just simply do not make any sense, but you really have to trade off of the market's reaction to these news events.

We have the usual weekly Jobless Claims at 8:30AM, but also the Leading Indicators and the Philly Fed, both at 10:00AM. We also have DFS, FDX, LEN earnings pre-market. PALM, PIR, RAD report during the day and COMS, ORCL, ZQK, and RIMM report after-hours. The consensus for the Jobless Claims is 560K with a range of 530K-600K. I'm pretty damn sure the whisper number is higher than the consensus. Last week's number was 573K. Aren't states running out of money to pay for this stuff?


SPX 1-day

SPX 3-day

SPX 5-day

SPX 10-day

SPX 2-month

SPX 6-month

Don't forget to try the Free Trend Analysis. It's FREE, so give it a shot!