Empire State Manufacturing
The index’s reading came in at -25.4 for November (issued on Monday). The previous reading was -24.6 and the consensus was -26 with a range of -40 to -14. You think only white-collar workers in NY have it tough? The number of factory workers index dropped -25 points to -28.9 so this shows that employees of all ‘collar spectrums’ are having significant trouble in NY and it is a sample of the broad national manufacturing sector.
 Industrial Production
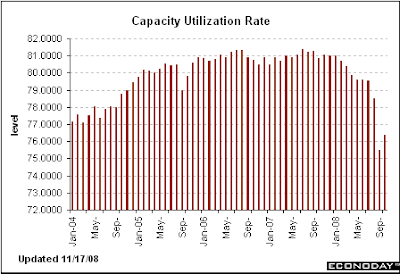
Industrial production rose to 1/3% from a September reading of -2.8% with a consensus of 0.2% in the range of -3% to 2%. Much of the blame is still being placed on hurricanes Gustav and Ike and the Boeing strike. The important thing to note is that the industrial sector makes up a bit less than 20%. Capacity utilization rose to 76.4% from September’s reading of 75.5% with the consensus being 76.4%. This indicator is used to measure operating limits and it fell off a cliff.

 Producer Price Index
The PPI fell considerably (see sharp spike below) at a rate of -2.8% in October vs. a decline of -0.4% in September. This -2.8% figure was much greater than the -1.7% consensus. The core PPI actually increased 0.4% due to strong prices for trucks, aircraft, and…beer. Since the vast majority of sectors are weak, the strength in these sectors should weaken. The largest declines came from cars, pharmaceutical prep, and computer/tech equipment. I anticipate a sharper decline in auto demand that will being down the core PPI.

Consumer Price Index
The drop in energy prices helped, but there was clear evidence of weakened consumer demand. The reading for October came in at -1% vs. 0% in September and a consensus of -0.7%. The core dropped -0.1% and the biggest hits came from autos and apparel retailers (no surprise here). Even though the CPI is declining, that doesn’t mean it’s a good thing since almost everything besides food and energy are taking a hit, adding to the current recessionary profile.
 Housing Starts
The Housing sector, in general, is the root cause of this entire crisis. Housing prices continue to decline making all those toxic securities even more worthless. The lack of credit is preventing buyers from buying and sellers are unable to unload their property. This lack of activity is not giving incentive for builders to build. We can see in the chart below that it happened since Jan 2006 and this relentless spiral is not letting up. The reading for starts came in at 0.791 million vs. September’s 0.817 million. Permits fell to 0.708 million vs. September’s 0.786 million. What’s interesting is that the West and South posted gains of 7.5% and 1.5%, respectively. The Northeast declined by 31%. With the amount of layoffs/future layoffs in NY and the surrounding areas, this decline should only increase. The Midwest fell 13.7%, and if any automaker fails, this decline should spike.
 Jobless Claims
This week’s claims were terrible indicating that there were 542K new claims this week compared to last week’s 516K. This is the biggest jump wince 1992. The consensus of 505K was blown out of the water. But you know what, I expect even more pain. Claims will most likely hit 600K+ by the end of the year as layoffs ad unemployment accelerates. With the number of cuts being announced on a daily basis, it is impossible for this number to decline by the end of the year. I still compare jobless claims with the VIX’s initial meteoric rise.
 Philadelphia Fed Survey
The Philly Fed survey index dropped to -39.3 from -37.5. The consensus was -35 within a range of -45 to -24.8. There’s no question that Philly is in a recession and this survey is only a snapshot of what’s going on around most of the country. Prices paid this month was -30.7 compared to +7.2 in October and prices received was -15.5 this month compared to +5.3, both are enormous differences. There wasn’t a single positive reading in any sub-fields in this month’s survey and should to tell you a lot.


No comments:
Post a Comment