Showing posts with label BTU. Show all posts

Monday, October 20, 2008

TODAY'S BREAKOUTS

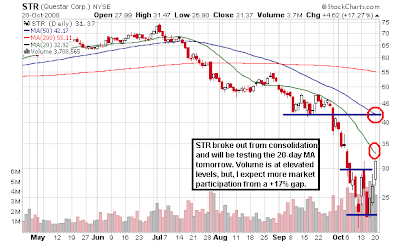
Emphasis is placed on breakouts rather than breakdowns because today is the first day where I’ve seen more breakouts than breakdowns in a very long time. We are at a weird stage in the market right now. Many stocks have broken out to the upside, but most stocks are still within consolidation. Given that we have hundreds and hundreds of earnings reports this week, the market will continue to be volatile. Even today, the market zigzagged, forming an ascending triangle, which later broke out. Again, I am seeing considerable strength in the materials and industrials sectors and they are leading whatever rally we do get.

Most break outs, including the ones listed below are at a point where they are going to test 1) the 20-day MA, 2) September’s low, and then 3) the 50-day MA. The 20-day MA is not some magical indicator, but it’s what most stocks primarily follow during uptrends and is a secondary indicator for downtrends. These three present key resistance levels that need to be broken for stocks to climb out of their hole. It won’t be easy, but here are several names to focus on:


Don't forget to try the Free Trend Analysis. It's FREE, so give it a shot!

Thursday, October 16, 2008

TODAY'S BREAKOUTS & DOUBLE BOTTOMS

I have to say we did well today by forming a double bottom. I went 100% long into the close given the strength of the rally (which didn’t breakdown in the last half-hour). Looking at a 10-day chart (below) what’s so bullish about this is that the right bottom formed slightly higher than the left bottom and we only needed the nearest support level above Friday’s lows. Another great signal for the right bottom is that today’s particular intra-day bottom formed an Adam-and-Eve bottom. Adam’s are spikes down and Eve’s are rounded cups. Together, the Eve bottom formed the higher low that I needed to confirm entering long positions.

We did very well today forming 7 new highs and 865 new lows (that’s an accomplishment this week). We also had stronger volume than yesterday, but still weak comparing Friday’s bottom. That should be your worry going forward – volume.

I found only one clean breakout and it was AirTran Holdings (AAI). All of the airlines jumped double-digits today as oil fell below $70 today. What’s great about technical analysis is that all you need to do is look at the chart and notice the breakdown at the 40-day MA then the 50-day MA and you’ve steered clear. If not, you probably listened to all these pure-fundamental guys preaching on the way down that “it’s just gotta go back up”! The chart tells you exactly how it is and what all market participants are thinking and that’s represented by price action and volume. IF we do go back up, the chart will tell you if it will hold. AAI has one more resistance area at around $3.50 before it’s able to spike to $4.25.


Instead of featuring mostly breakdowns like I have for several days now (like I had a choice), I opted to profile several stocks that exhibited a possible “double-bottom” pattern. This is not to say they’ll all go up, but given the volume and price representation, there’s a good chance that many of these stocks will spike higher (most are in the industrials/materials sector). It could last for only a day or several weeks, who knows, but for the very short-term, I think they’ll be ok. Please use the 20-day MA as initial (major) resistance after (if) they breakout of consolidation resistance. Most importantly, remember to do your own due diligence.

Don't forget to try out the Free Trend Analysis. It's FREE, so give it a shot!