1) "As long as this pattern holds, it is bullish..." -- the short-term pattern broke, therefore, it wasn't as bullish anymore. The odds have become about 50/50, without any great edge to one side.
2) "As long as we stay better than -1% down on the market, it remains in the control of the bulls..." -- the bears took control when the market fell past -1%.
3) Regarding the VIX: "There is support at 45, so watch yourself." -- the VIX hit a low of 44.50" and bounced. Don't say I didn't warn you. Gio is Master of the VIX.
4) "Bears...you guys need to drop this [market] way below 900 on the SPX and break this [market] in half" -- A 50% long/50% short hedge alert was produced right after a drop below 900 at 2:01PM. The bears broke the market down in "half" afterwards, which is now at pre-Fed levels (look at a 5-day chart).
There are always conditions/stipulations that need to be met as the market evolves. Any violations will change the entire picture and the odds, instantly. Most conditions above were not met, therefore, it was correct to be neutral 50/50 into the close. The reliability of the consolidation diminishes significantly if the correction exceeds the breakout day's halfway point. That's why I'm holding both FAS and FAZ until the time is right.
Who knew that an S&P outlook downgrade on GE could drop this market so hard? We had Jobless Claims, Philly Fed, various earnings, and everything else come out this week that didn't drop the market. Today is a day that reminded people to stay nimble in the face of continued uncertainty.
The 50-day MA is the single most important intermediate-term support/resistance level. This is starting to resemble the market's rally in August to the 50-day where it made two attempts and completely gave up. There could be several attempts here as we are not yet out of the ascending triangle/wedge as evidenced by the 10-day chart. Proceed with caution as that range is narrowing.
It now comes down to testing the 30-day and 20-day MA's. Right now, it basically comes down to: 1) the market MUST close green, preferably above the 50-day MA, or else the market will break it's uptrend (10-day chart). Also note that the auto bailout has not yet been resolved. Don't forget options expiration--quadruple witching tomorrow. It could be get crazy.
One thing to note that's pretty important is that the market WAS being led by #1 Financials and #2 Materials. Both sectors are no longer leading.
In other news, I obtained a high score of "17" in the fun game of hitting Bush with cheap Iraqi-made shoes. See if you can beat my ninja skills at SockandAwe.

 SPX 1-day
 SPX 3-day
 SPX 5-day
 SPX 10-day
 SPX 6-month
 VIX 6-month
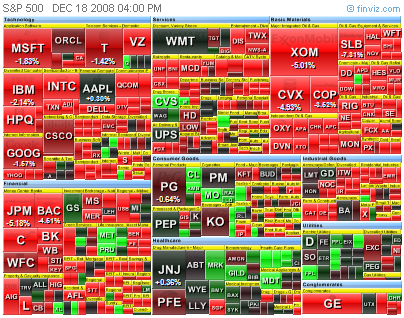


3 comments:
What is iBC?
ibankcoin.com
I'm the chart addict
Good article.
Post a Comment