1) We broke out of the narrow range and formed a Rising Five Method, a knock off of the Rising Three Method (I don't know if that secondary continuation pattern exists, but I just gave a name for it).
2) Today's volume exceeded the volume levels for the past five days. However, it's nowhere near the breakout levels that I wished to see. The volume must be maintained in subsequent days. I do not want to see a fall off in volume.
3) We re-entered the 880-920 range after having threatened to breakdown the past 2 days. This is considered a neutral move, but more bullish for today's action.
4) We are above the 50-day MA on all three indices. The SPX and DJIA are clearly above while the COMP is 2 points above the 50-day MA. However, just because we closed above it doesn't mean that it gets easier from here. There needs to be incoming momentum to fuel this rally or it's dead.
5) The ascending wedge (COMP) and the ascending triangles (SPX, DJIA) now have the highest chances of breaking out (920+ SPX) to the upside. As long as the market doesn't drop -2.5% or more, the bulls should be ok.
6) Financials led the rally. The banks were the big buys today. (3:09PM - Add 25% financial longs order issued). Of course, they're going to benefit the most from the Fed's actions, now and in the future. The 2nd best sector was the industrial/materials sector combo.
Some Concerns:
1) Oil lagged. I'd like to see oil move in tandem with the market to support the rally. A further decline in oil will obviously impact the strength of the rally. Massive volume spikes the past several days suggests that a decline in oil may come to a short-term halt.
2) This is still a bear market rally. Don't get caught with your pants down.
Interesting. You know how CNBC started those "I am CNBC" self-promotion commercials? Well, as I write this, I heard that Melissa Francis is a "a Harvard grad...an anchor...a frustrated hip-hop artist?". Please. That's ridiculous.
In other news, I think Rebecca Jarvis looks like this warrior elf:
 Similar?
Anyway, the possibility of a pullback to 902 or even as far as 882 on the SPX is possible. If we break above 920, we would have cleared almost every major resistance level until 950. Looking at the 10-day chart, we can see that the SPX is sitting right on near-term support at 910. I have no idea what to do until I see the first 15-30 mins of the open. If we get a major gap up or down, that could change my assessment.
The bottomline is that a move like this cannot be ignored. This was obviously a powerful move and technically pleasing to my eyes. This could be the beginning of a measured move up. Don't forget that we have earnings from MS, CAG, GIS, CMC, JOYG, APOG, NKE, PAYX, TTWO, and a few others. Before we get too excited, keep in mind that the auto bailout has not yet been resolved.
Support levels for the SPX are 909, 905, and 887-900. Near-term resistance is at 920, which will be tough to crack. Enjoy the rally, but be ready to bail if things look bad. This is still a short-term trader's market. Remain flexible, or you will lose money and end this year empty-handed. Not good for the Christmas spirit.

 SPX 1-day
 SPX 3-day
 SPX 5-day
 SPX 10-day
 SPX 6-month
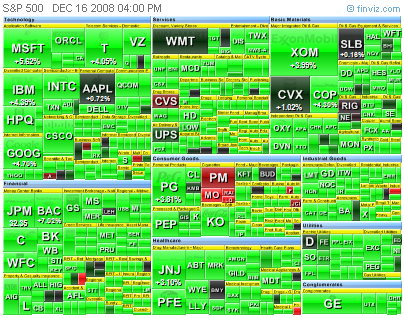


5 comments:
Hey, John, so I was looking at my chart today asking myself is there a rising 5 method..seriously,where else am I going to find a blog like this?
You just found it.
hi John,
how many years have you been trading? And where did you get your training?
7 years. Taught everything myself.
It is all a basic return to the old IS-LM theory, along with the old hope that there will be a "multiplier effect" and that forward deficit spending will grow the GDP.he idea generally, is as follows: Given any level of aggregate demand, producers will labor to meet that demand and hence, output will rise or fall towards a point of equilibirum in relation to said demand up to a point of full employment. The idea of a "multiplier" assumes that deficit govt., spending and expendatuture will generate income for some people, and thus, some of this income will be used to consume, thus, generating yet more income for others and thereby creating still more aggregate demand. Another part of all this is the measure of inflation based upon a model known as "The Philips Curve." Problem is, is that in the Seventies, a nasty thing called "Stagflatio", rendered the IS-LM, Philips Curve models mute. Now folks like Krugman argue the models were wrong. Others think the entire theory was wrong and that Post WW II Prosperitiy was due mostly to demographics, thereby postiing that folks are now in current thinking making a fatal logicla flaw of a "non distributive middle", that is to say, and more simply put, that; "Correlation is not Causation".
But, we are going to try it all again anyhow, and one might therefore ask, when this noble experiment is over, in that the Philips Curve can never account for certain extraneous factors like; market psychology, demographics and sociology, developmental economic models which react against our own domestic monetray policies for their own societal needs which certainly do not always correspond with our own, and last but not least, all the implied inflation still at the margins based upon commodities each one with its own implied volatilities, it never quite seems to work out as planned. Milton Friedman shall return, because the older, more classical truthes are still bascially...true. But, for now, what will be will be. Anyone who doubts this, might want to catch a quick glimpse at what has happened to both M1 and M2 of late.
Post a Comment