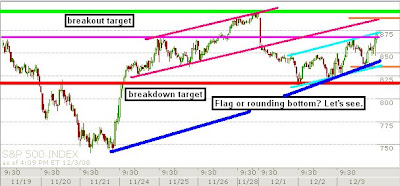
At one point, I made back my +27% gain from Monday (+ more), but my December gain now stands at +6% at the close. I cut out all of my leverage intra-day and added 25% long positions as a hedge (financials) while scapling this damn market to offset a total evaporation of paper gains. I'm waiting for a secondary entry point tomorrow on any massive breakdown.
On the sentiment side, Bill Miller came out and called a "bottom". Others paraded on CNBC to call a bottom as well. Too many people are bullish in a bear market. This needs to be cleaned out unfortunately. There cannot be a bottom if there is still optimism. This means Bill Miller has got to go, sorry.
Looking forward, there are two possible formations after today's action. First, a bear flag. They tend to slope higher, but the breakdown needs to be immediate and sharp after consolidation. Second, we could actually be rounding out (unlikely). This new element sort of changed the risk/reward picture and therefore I had to account for a slightly bullish case within 10 mins of today's close. However, I am still majority net short (75% short/25% long).
Expect some massive resistance at the 20-day (presently) and 30-day MA's (coming up). No joke. I will use my reserve margin (100%) plus extended institutional credit to (200%) short the living daylights out of this hellish market when I feel comfortable doing so. That point will be a roll over to the downside, breaking the "blue line" in the 10-day chart. I'd like to point out Danny's post. His LoBV and Buy/Sell Strength charts look bearish as hell.
And you haters thought I lost real money today. LOL, please. I never had a losing month this entire year and December 2008 isn't going to break that. You can keep dreaming for my demise. I shall make note of when I do max out on one side (preferable short) as I have the use of massive leverage to bring me back to my +27% on any real confirmatory action.
This is all true unless someone proclaims the Second Coming or a New Paradigm, at which time I will switch out to a 400% long position. Or, the SPX breaks out and closes above 900 in which the above will still apply.


2 comments:
John,
I am new to this and trying to get the hang of technical analysis. Looking at the daily charts for S&P/Dow it looks like they are in desending 'wedge' with a Breakdown/out area sometime in feb. where I think there is considerable support and a feasible bottom (i believe bottom more on a macro view than a strictly technical call). Is my analysis way off?
Thanks,
Jay
that's more long term. TA works better in shorter time frames. We could be rounding out but we could be doing other things in a few months time.
Post a Comment