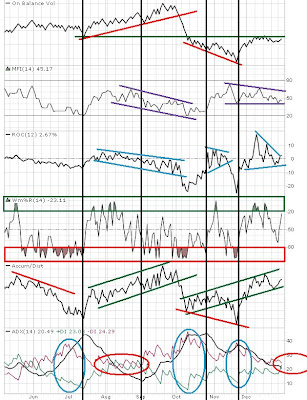
I usually don't cover much on technical indicators because I don't need them every day. I like to take a look at them once every 2 weeks or so just to see what all of these indicators are trying to tell me.
There are not perfect and they are not "sure things". The purpose of these indicators is to confirm price/volume action and their significance should not exceed those of the basics (price, volume, candles, moving averages, sup/res, etc.). What I like to find when analyzing indicators are divergences among them. Just as volume sometimes creates a divergence with price, so do technical indicators with the broad market.
There are many indicators, but here are twelve that are commonly used:
1) RSI (Relative Strength Index)
2) MACD (MA Convergence/Divergence)
3) CCI (Commodity Channel Index)
4) TRIX
5) Force Index
6) Slow STO (Slow Stochastics)
7) OBV (On Balance Volume)
8) MFI (Money Flow Index)
9) ROC (Rate of Change)
10) WM%R (Williams %R)
11) A/D Line (Accumulation/Distribution)
12) ADX (Average Directional Index)
Friday, January 2, 2009
Subscribe to:
Post Comments (Atom)


No comments:
Post a Comment