THIS WEEK’S ISSUE: - In-Play: The Battle for Wachovia (WB)
- Market Commentary: S&P 500 ($SPX), NASDAQ ($COMP)
- Update: Russell 2000 Small-cap Index ($RUT)
- Update: NYSE/NASDAQ/AMEX New-Highs/New-Lows Index, CBOE Volatility Index (VIX)
- Currencies: U.S. Dollar Index ($USD), Euro Index ($XEU)
- Commodities: Crude Oil ($WTIC), Gold ($GOLD)
- This Week’s Economic & Earnings Reports
U.S. FUTURES (as of 6:00AM EST): DJIA (-2.59), SPX (-2.95%), COMP (-2.94%)
IN-PLAY: THE BATTLE FOR WACHOVIA

Haha…I posted Part 1 of the battle on a previous post on my blog (http://www.weeklyta.blogspot.com) so I’ll get on with the developments, which is part 2 of the comic. If this goes on for a while, I will create an entire comic strip to chronicle the event. It’s an exciting and educational way of breakdown something that’s extremely complicated.
What’s happening now is that on Saturday night, Citigroup (C) asked NY Supreme Court Justice Charles Ramos to issue a order blocking the sale between Wachovia (WB) and Wells Fargo & Co. (WFC). Citigroup’s claim is that WB breached the exclusive agreement (entire agreement found on my blog) between WB and C. C is seeking $60 billion in punitive and compensatory damages against WFC for interfering with the deal.
In response, WB asked U.S. District Judge John Koeltl to declare that the agreement between WB and WFC “is valid, proper, and not prohibited by a letter agreement between WB and C. Koeltl vacated Ramos’ order, however scheduled a hearing tomorrow (Tuesday) for all parties to present their case. This is a complicated matter that can last for a very long time since both WFC and C are large institutions with a lot of money, backing, and attorneys and neither party will back down without putting up a fight. What’s for certain is that both WFC and C has devoted considerable resources in terms of time and money to engage WB, therefore, both institutions have personal interest to get this deal done. The question is: Who will win?
When WB signed the agreement with C to sell their banking operations, it was noted that if WB did not sell part or all of their operations, they risked seizure by the FDIC the very same day. Therefore, the ultimate loser in this battle is WB with possibly only days to survive. In any case of failure, the FDIC would step in as it has done many, many times this year.
The most important section of the letter agreement between WB and C is the following paragraph:
"In consideration of the foregoing and other good and valuable consideration the receipt and adequacy of which are hereby acknowledged. Wachovia hereby agrees that, during the period commencing on the date hereof and ending on Exclusivity Termination Date (Oct 6,2008), Wachovia shall not, and shall not permit any of its subsidiaries or any of its or their respective officers, directors, employees, investment bankers, attorneys, accountants, consultants or other agents or advisors ("representatives") to, directly or indirectly. (i) solicit, initiate or take any action to facilitate or encourage the submission of any Acquisition Proposal, (ii) enter into or participate in any discussions or negotiations with, furnish any information relating to Wachovia or any of its subsidiaries, assets, or businesses or afford access to the business, properties, assets, books or records of Wachovia or any of its subsidiaries to, otherwise cooperate in any way with, or knowingly assist, participate in, facilitate or encourage may effort by, any third party that is seeking to make, or has made, an Acquisition Proposal....."
However, many people argue that the letter agreement is non-binding. I am neither an attorney nor do I have inside information on the matter but it appears that this case is not clear cut. I do agree with the fact that the deal between WFC and WB may be the best for shareholders given that the deal goes not require government assistance, keeps WB intact, and benefits taxpayers. Ultimately, shareholders and regulators will have to approve of any deal and that cannot take place during litigation. What everyone can agree on is that a deal must be consummated quickly. This has once again placed uncertainty in the markets in a time where we don’t need any more uncertainty.
According to the Wall Street Journal, C and WFC may “carve out” WB with C taking WB’s northeast and mid-Atlantic branches and WFC taking southeast and California branches to reach a compromise. No deal has yet been consummated at the time of this writing.
MARKET COMMENTARY – SPX 1,099.23, COMP 1,947.39

The market continues to decline, hitting new lows 2-3 days out of the week. As I mentioned before volume must confirm price action. Once the short ban on financial stocks began, volume on all exchange got cut in half. This past week we are again seeing volume increase on the down days and volume decrease on the up days, which is bearish. This has occurred many times and I have stated this many times in previous commentary. The start of a major rally and the subsequent confirmation days must be confirmed with volume. With the short ban in place, that is extremely difficult to do.
I would like to point out that we may see a short-term low, marked by a capitulation day sometime this week. I am looking for a major gap down at the open today possibly followed by a sharp decline. If a sudden and sustained rally does occur and closes near its highs, then it is time to go long. I am advising all short positions to be covered during the weakest first hour of today’s trading. This is in support of the major oversold levels in several technical indicators, mainly the slow stochastics. This will be corrected soon.
The SEC stated that the short ban will be removed 3 business days after the bailout plan is signed into law. This could be Wednesday or Thursday, depending on the time in which the SEC decides to remove the ban. We should see a marked increase in volume on Thursday and Friday as a result, giving the market the opportunity to act in an undisrupted manner.
As for support levels, the 10,000 level in the DJIA is key support in 2005, the S&P 500 must hold the 1,000 level which is a key level in 2004 and the NASDAQ must hold the 1,900 level which is a key level in 2005.
UPDATE: RUSSELL 2000 SMALL-CAP INDEX ($RUT)

I’m adding the Russell 200 ($RUT) in a separate section to highlight the importance of the index this past week. Below, the chart on the left is a 5-year chart and the one to the right is a 10-year chart:
The significance is that the RUT broke out of its consolidated reactionary rally on Friday and hit a new low. The RUT is the last remaining index to decline to the levels of the DJIA, SPX, and the COMP. Looking at a 10-year chart (to the right), we have a long ways to go for the small caps. The larger capitalized stocks took the first hit in 2008 and it only makes sense for the small-caps to follow suit. Due to their smaller size, small-caps face a greater risk of a sharper decline in the next few months. Also note that the other 3 indices started their 3rd primary leg down and the RUT only started it’s 2nd primary leg. This divergence will soon be corrected and I expect the RUT to take the largest hit in the next few months of all indices.
Critical support is at 600 in 2005, which I expect it to break. Afterwards, the 500 level in 2004 is the next target area. At this point, given the sharp decline in the past two days, I expect the RUT to decline in a sudden, volatile and erratic move. Expect considerable selling in the small-caps in the coming weeks.
On the head-and-shoulders pattern, every technician views a pattern slightly different from other technicians. In the 5-year chart (to the left), I view the pattern drawn by the blue lines. Others may consider the purple lines. In either case, there is no disagreement that the pattern has now been reached due to break in the necklines.
UPDATE: NYSE/NASDAQ/AMEX NEW-HIGHS/NEW LOWS INDEX, CBOE VOLATILITY INDEX (VIX)

Below are the New-Highs/New-Lows Indices for the NYSE, NASDAQ, and AMEX. Notice that we are still hitting a lot more new lows than new highs. On Thursday, we hit 5 new highs and 778 new lows and on Friday, we hit 4 new highs and 1076 new lows. This gap is getting wider and wider, killing the chance for a major recover that certain people are still preaching about. Charts do not lie and they paint a very clear picture of what is going on in the markets. This is an undeniable truth in technical analysis. Notice how the AMEX fell the sharpest – most companies on the AMEX are small-to-micro caps. These indices must improve for any confirmation of any type of rally.
I stated in the previous commentary that the VIX will breakout and stay elevated in the 40’s level. This has held true. This is a high-and-tight flag that formed, and these patterns have extremely high reliability and a low-failure rate. These patterns are one of my most favorite patterns to look out for. The VIX is currently consolidating between 40 and 47, however, there is concern as the pattern is overextended. I do expect a bounce in the markets this week and also a slight pullback for the VIX. The fear level remains elevated now that Europe and Asia are the next regions to fall amid the credit crisis.
CURRENCIES: U.S. DOLLAR INDEX ($USD), EURO INDEX ($XEU)
Focus is placed on the U.S. Dollar and the Euro because of the significance of the levels they are at. The USD made a new high and I do expect consolidation, if not a breakout higher. The XEU is testing support. On long-term charts, it appears that the USD will be heading higher after forming a higher low and the XEU will be heading lower. These trends can remain in place for many months unless there is a great and sudden shift in global macro factors affecting both currencies. Both currency indices use the 50-day as support (USD) or resistance (EUR) and make note of their guiding pattern.


COMMODITIES: CRUDE OIL ($WTIC), GOLD ($GOLD)
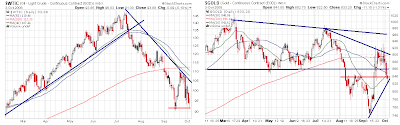
Just like the XEU (Euro Index), commodities such as oil and gold are testing support levels. Oil follows the 40-day MA and gold follows the 20-day MA as of now. Make note of their respective support levels and react to any clean and full breakdowns. A low-risk trade would involve waiting for a confirmation day of any bounce or a continuation of the decline.
THIS WEEK’S WATCH
- Make note of any intraday reversal and rally into the close on either Monday or Tuesday to make capitulation day. Expect the market to gap down considerably in the morning.
- Pay attention to the VIX
- Note successful or failed tests in support/resistance for the USD, XEU, Oil, and Gold
- Be aware of the notable economic and earnings reports below
Noteworthy Economic Reports: Mon. (ICSC-Goldman Store Sales – 7:45AM, Consumer Credit – 3:00PM), Tues. (MBA Purchase Applications – 7:00AM, Pending Home Sales – 10:00AM, EIA Energy Status – 10:35AM), Wed. (Chain Store Sales, Jobless Claims – 8:30AM, Wholesale Trade – 10:00AM, EIA Gas – 10:35AM), Fri. (Import/Export Prices – 8:30AM, Int’l Trade – 8:30AM, Treasury Budget – 2:00PM)
Noteworthy Earnings Reports (planned): Mon. (AEP, IDT, VOXX), Tues. (PAR, AYI, AA, ZZ, YUM), Wed. (COST, LNN, MON, RT), Thurs. (RBN, SABA), Fri. (GE, HST, SLAB)
BLOG OF THE WEEK: HEADLINECHARTS BLOG! (http://www.headlinecharts.blog.com)
 Did you hear what I said? There needs to be a strong close. This means that if a "WTF" pattern popped it's head up at 3:55PM and crashed the market, then this negates everything. For the open, I'd prob add an initial starter position in the banks, then either 1) add on sustained momentum, or if the gap suddenly fills, 2) add on a breakout of the gap's opening price. Both are determined in the first 15-30 mins of trading. Trade accordingly.


